Greenflation, the new normal?
13 - minute read
The war in Ukraine is feeding the inflationary spiral. If the second half of 2021 was marked by inflation prompted by the global success of stimulus plans to recover from the pandemic, the Russian invasion rushed the world to inflation levels unseen since the 1979 Iranian Revolution.
Inflation has been at the core of 2022 French presidential election. Voters’ first preoccupation in this troubled period was purchasing power. Environment and climate change are one of the main concerns as well [1]. These concerns are linked. One cannot lastingly address one, without addressing the other. Sustainable finance approaches and products must help conciliating these concerns.
3 main phenomenon linking inflation and climate change can be highlighted:
- On the short term, dependance on fossil fuels and disordered transitions towards low carbon energy mixes materialize in primary energy markets’ volatility.
- Supply chains disruptions caused by climate change physical consequences (ex: severe droughts) put an upward pressure on prices (soft commodities).
- Increasing demand for renewables, electric vehicles and batteries pull prices of critical metals along when unmatched by supply (copper, aluminum, cobalt, nickel, etc.).
These three climate-related phenomena are of different nature, but all have the same consequence: variation in prices and often, inflation. These phenomena are regrouped under the misnamed “greenflation”. In the present article, they are discussed as climate-related inflation, referring to the more granular approach developed by ECB’s Isabel Schnabel work, which is presented below.
The fight against “climate-related” inflation can prove to be an opportunity bringing co-benefits along. Demand-side management as well as value chain strategic positioning are among the few levers identified to balance the mismatch between demand and supply. Both levers mean increased investments in specific sectors (critical metals, agriculture, public and clean transport, shared mobility and others) to accompany the energy transition and spur behavioral changes. Sustainable Finance must provide the right frameworks to address these challenges simultaneously.
******
Contents table
I - Greenflation, myth or reality?
1) Fossilflation, fossil fuel markets under constraint
2) Greenflation, critical metals shortages at stake
3) Climateflation, the consequences of climate change as an inflation driver
4) European Central Bank's reactions
II - Dynamics of climate-related inflation
1) Inflation, a global phenomenon with differentiated impacts
2) Demand-side mitigation, the answer to the mismatch between supply and demand
3) Value chain reshuffling through strategic positioning
******
I - Greenflation, myth or reality?
“The transition phase may bring protracted period of higher energy inflation” stated Isabel Schnabel, Member of the ECB's Executive Board, on January 2022.
Economics is not an exact science and here “woulds” and “mights” are kings. Inflation and its drivers are of macroeconomic magnitude and estimations build on uncertainties as economists can hardly envision the magnitude and consequences of global warming. Nonetheless, 2021 brought a protracted inflationary period linked to both energy and food, two domains related to our societies’ capabilities to both mitigate and adapt to climate change. Some economists were quick in establishing a potential causation link between inflation and the way societies address climate change. To quote a few, the Financial Times, the Economist and the like, all had their pieces on “greenflation”.
An article nonetheless made a conceptual clarification over these climate-related inflationary phenomena. On March 17th, Isabel Schnabel, Member of the ECB's Executive Board proposed a structuring distinction between 3 sources of climate-related inflation [2]:
- Fossilflation: Higher volatility and increased inflation caused by a disorderly transition: a contraction of fossil fuel supplies unmatched by efforts on demand (oil & gas shortages) as well as carbon taxes and prices.
- Climateflation: Extreme weather events cause supply chain disruptions in ecosystem services dependent sectors (agriculture, fisheries, forestry, energy and tourism).
- Greenflation: Inflation caused by increased capital investment to comply with climate objectives: demand increase of critical material and resources necessary to the energy transition (lithium, cobalt, nickel, graphite and manganese) unmatched by supply.
Figure 1: Three entangled climate change-related inflationary phenomena
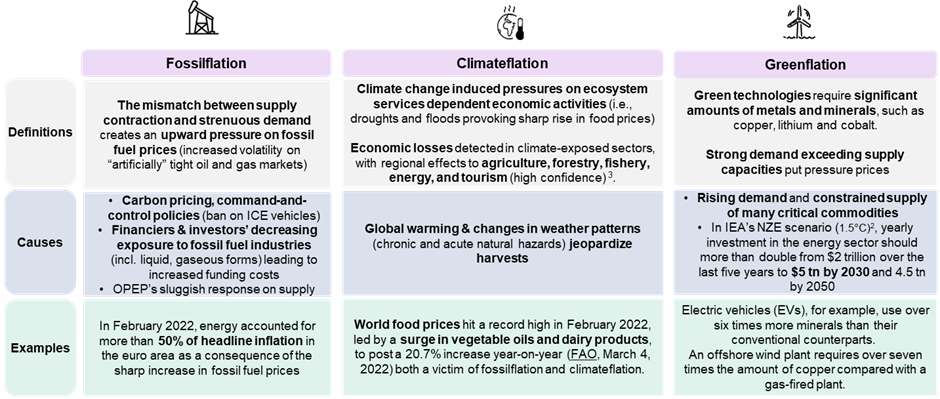
Source: Natixis based on ECB paper [2]
1) Fossilflation, fossil fuel markets under constraint
Between May 2021 and February 2022, energy contributed, on average, more than 50% to Harmonised Index of Consumer Price (HICP) inflation (Figure 1). Two of the causes identified are a strong post-covid demand unmatched by supply because of years of lower investment in oil & gas production [3] and tight oil markets with OPEC members struggling to increase production [4].
Figure 2: Energy contribution to the Harmonised Index of Consumer Prices
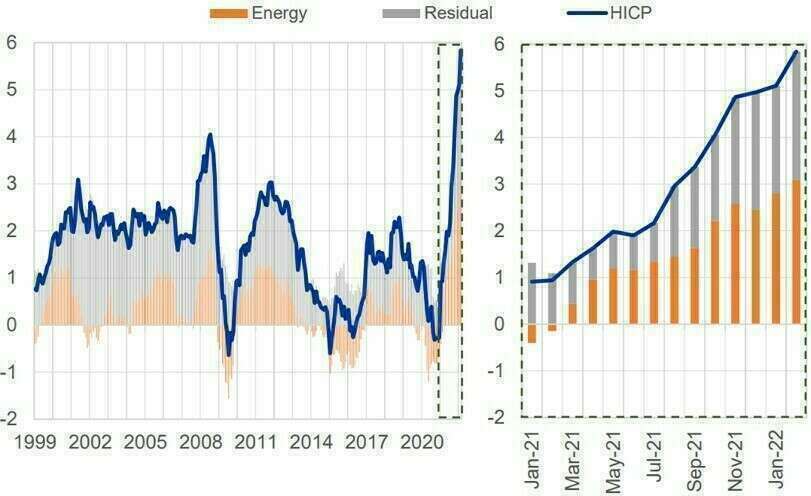
Source: Eurostat and European Central Bank
Decreased investment in oil & gas upstream activities was first driven by low prices (since 2015 for oil & gas) and to some extent, pressure from financiers, investors and civil society to reduce economies’ exposure to fossil fuels (Youth For Climate / Fridays For Future etc.). Under-investment has also become a way for the world to meet its climate objectives: IEA Net Zero scenario provides clear indications to meet Net Zero by 2050, including “No new oil and gas fields approved for development"[5].
Investment levels in oil and gas production should be sustained (not increased) at pandemic level (Figure 3) to 2030 to meet global climate goals (Net Zero emissions by 2050). Based on countries and companies pledges, IEA estimated that stated and announced policies (STEPS) fell short of the effort needed to limit global warming to 1.5°C (Figure 3). Investments in Oil & Gas are expected to reach a yearly average of USD 700 bn between 2022 and 2030 whereas they should not exceed around USD 380 bn to reach Net Zero by 2050.
Figure 3: Investment in oil & gas in the Stated Policies and Net Zero Emissions by 2050 scenarios (Bn USD)
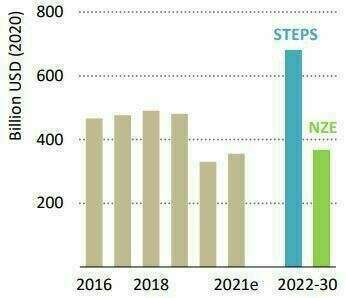
Source: World Energy Outlook 2021, (Oct. 2021) IEA
Respecting the Paris Agreement and maintaining stable economies are the two constraints between which governments must navigate. A tool that governments have been using to navigate these troubled waters is the price on carbon or carbon taxes. The price on carbon mechanically impacts energy prices all the while incentivizing to reduce their use. However, a study on 35 OECD economies from 1995 to 2020 has demonstrated that an increase in carbon taxes and prices of permits in Exchange Traded Schemes (ETS) had no significant effects on energy prices [6].
Nonetheless, world economies seem to have entered a disorderly transition scenario by undermining or postponing demand-side measures. That economic situation puts a structural upward pressure on prices if demand is not to be adjusted (which seems to be the case for now). In a disorderly transition, conjunctural moves in oil and gas prices (covid, war etc.) are to be overshadowed by a structural increase in volatility because of a systemic contraction of supply unmatched by efforts on the demand-side or alternatives’ availability (thermostat adjustment, shared or soft mobility, electric vehicles etc.).
2) Greenflation, critical metals shortages at stake
The International Energy Agency (IEA) [7] recalled that raw materials’ prices have a substantial effect on the cost of technologies required for the energy transition. Costs of lithium-ion batteries for example, were pushed down last decade thanks to economies of scale and the learning curve. As a consequence, raw materials’ weight in batteries cost structure grew from 40 to 50% of battery cost in 2017 to 50 to 70% in 2022 making it more vulnerable to variations in raw materials prices
Figure 4: Investment clean energy in the Stated Policies and Net Zero Emissions by 2050 scenarios (Bn USD)
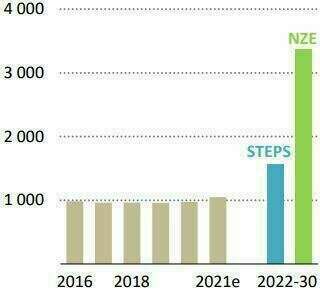
Source: World Energy Outlook 2021, (Oct. 2021) IEA
Figure 4 illustrates the tremendous need for investment in clean technologies (In green: at least triple until 2030 from 2021 levels) to respect the Paris agreement under IEA NZE scenario.
In energy generation, demand for critical metals is mainly driven by wind and especially metal-intensive offshore capacities followed by solar PV. Generation only represents a small share of the total mineral demand for clean energy technologies as shown in Figure 5. Most of demand remains driven by battery storage to compensate renewables’ intermittency, equip electric vehicles and the extension of electricity networks to decentralized generation sources.
Figure 5: Total mineral demand for clean energy technologies (in Mt)
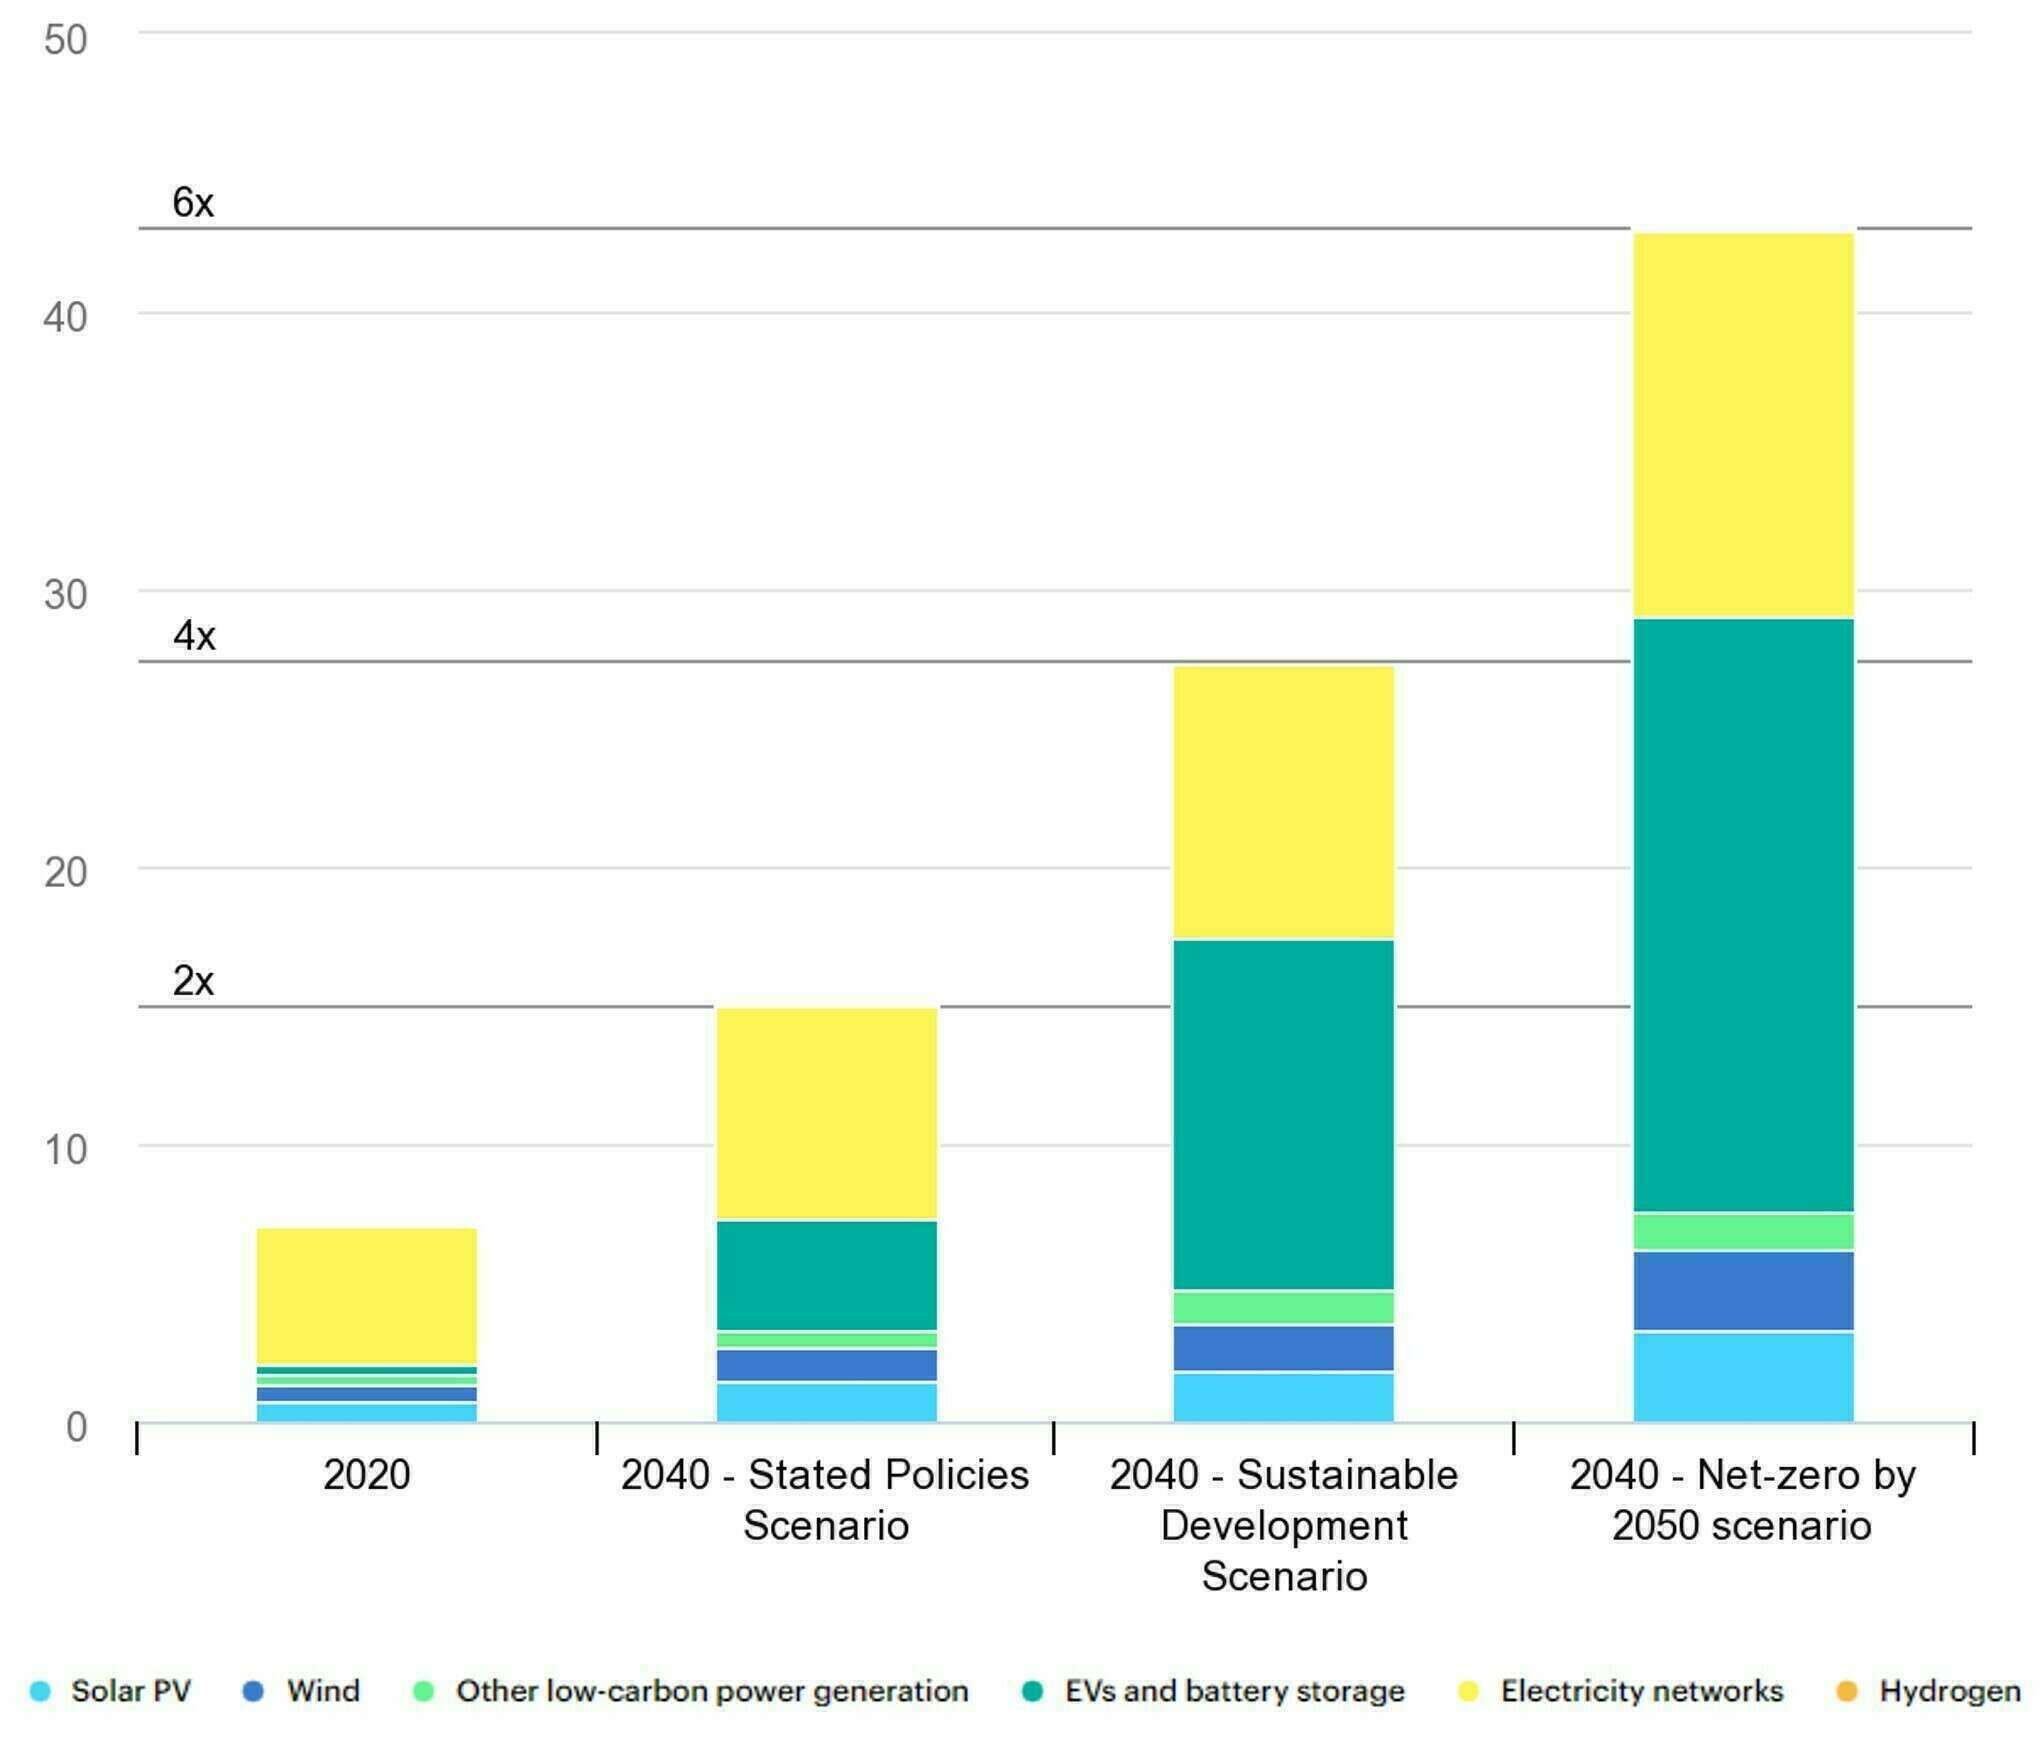
Source: IEA, The role of critical materials in clean energy transitions, March 2022
In the end, demand for minerals should be no less than 6 times larger than 2020 levels on a Net Zero by 2050 pathway. Nonetheless, mining capacities are not ready to absorb such demand, therefore creating an upward pressure on prices in the decades to come. Long lead times (16.5 years from discovery to first production) “raise questions about the ability of supply to ramp up output if demand were to pick up rapidly” ensuing in market tightness and price volatility [8].
3) Climateflation, the consequences of climate change as an inflation driver
On top of production capacity concerns, the mining industry is vulnerable to climate risks: “over 50% of today’s lithium and copper production is concentrated in areas with high water stress levels”. Extreme weather events might disrupt supply chains and jeopardize the energy transition by mechanically making it more expensive. This has been called “climateflation”.
If any industry can be affected by climate-change related events such as floods, tornados, droughts, extreme heats and wildfires, some are more depending on ecosystem services such as agriculture, fishery, forestry, energy with hydropower or even tourism for example.
Food prices have hit a new all-time high in March 2022. After hitting a record high in February 2022 driven by vegetable oils and dairy price increases, FAO’s Food Price index reached an unprecedented high in March because of the Russian invasion of Ukraine propelling cereals and vegetable oils prices through the roof [9].
Figure 6: FAO Food commodity price indices
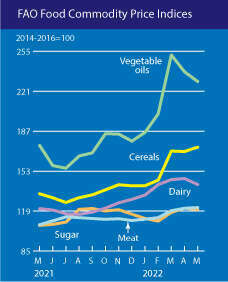
Source: Food price index, April 2022, FAO
The increase in food prices were mainly driven by a robust demand in the recovery from COVID-19. Besides the increase in demand, higher fertilizer and fuel prices increased production and transportation costs.
If no link was drawn between current inflation on food prices and climate change yet, the IPCC report on Impacts, Adaptation and Vulnerability (AR6 WG2) [10], underlined that “Climate change has caused regionally different, but mostly negative, impacts on crop yields, quality, and marketability of products (high confidence)”. Agriculture is not the only sector to suffer from climate change, “Economic damages from climate change have been detected in climate-exposed sectors, with regional effects to agriculture, forestry, fishery, energy, and tourism (high confidence)”. Climate change if not putting an upward pressure on prices in climate-exposed sectors is at least increasing prices volatility.
After the Russian invasion of Ukraine, wheat and sunflower oil prices rose because of supply chain disruptions in their production basins (Ukraine and Russia) and exporting areas (Black Sea).
It is now time for Europe to worry about soil dryness impacting crop yields. A pairing of abnormal temperatures (10°C above normal mid-May) increasing evaporation and soil dryness when wheat is flourishing and grains are filling (spring) are responsible for a foreseeable decrease in crop yields [11].
It is not sure whether the mechanic increase of wheat plantations because of price increases will compensate losses in crop yields due to abnormal heat and soil dryness.
As a consequence, after the start of the Ukraine war and before the announcement of India’s ban on wheat export, wheat prices reached a new all-time high on Euronext, exceeding € 400/t to reach € 408/t. India’s export ban on wheat which propelled wheat prices at € 435/t on May 16th 2022 [12], was motivated by concerns over its own food sovereignty facing:
- The war in Ukraine;
- Expectations of yield decrease due to record breaking temperatures in March and April hitting farmers in wheat-producing northern India. [13]
These are examples of climate change related events (changes in precipitation patterns, extreme temperatures) having an impact on prices and driving inflation. Inflation, whether caused by geopolitics, climate change or market dynamics does have consequences that go beyond mere price increases. One remembers that wheat and bread skyrocketing prices fed social unrest in Egypt and Tunisia in 2011 and led to Arab Spring protests. These two countries are the most depending on Russian and Ukrainian wheat per capita. The subsequent social turmoil contributed to war outbreaks in Libya and Syria.
4) European Central Bank's reactions
The European Central Bank is thinking about how to react to such inflation and envisions a long term approach facing climate-related inflation. Two solutions are being discussed at the moment [14]:
- Raising the inflation target but it would increase the costs of inflation (fall in real value of savings, downgraded purchasing power, higher taxes i.e. VAT etc.) and undermine ECB’s credibility and public trust.
- Excluding energy prices from central banks’ measures of inflation given that the energy transition is supposed to generate more volatility. The ECB identifies two problems with that solution:
- First, the transition will likely generate volatility and a persistent increase in the relative price of energy. Excluding energy from the Harmonized Index of Consumption Prices (HICP) would ignore that persistent increase.
- Second, energy expenses represent 10% of total consumption expenditure in the euro area and even more for lower income households. Ignoring a persistent energy price increase would undermine ECB’s mandate to protect price stability.
Different ways to measure inflation are being discussed in order to give less weight to highly volatile categories of products. These are mainly the Persistent and Common Component of Inflation (PCCI) and trimmed mean measures.
II - Dynamics of climate-related inflation
1) Inflation, a global phenomenon with differentiated impacts
If inflation hits markets globally, its impacts have been differentiated locally. Indeed, electricity and gas as well as transport are now the main drivers of headline inflation in Europe in March [15]. Dependency on fossil fuels have been the main differentiator. France for example, whose industry and electricity mix are less dependent on gas, has a lower inflation rate than all of its neighbors in 2021 and 2022 (In March 2022: France: 5.1% vs Spain: 9.8%, Belgium: 9.3%, Germany: 7.6%, Italy: 6.8%). Other factors are to be considered but the preponderance of energy as the main cause of inflation (as seen in Figure 1) supports this argument.
Figure 7: Inflation rates and carbon intensity of electricity mixes in the Euro area, France, Germany, Italy, Spain and Belgium from 2018 to 2021
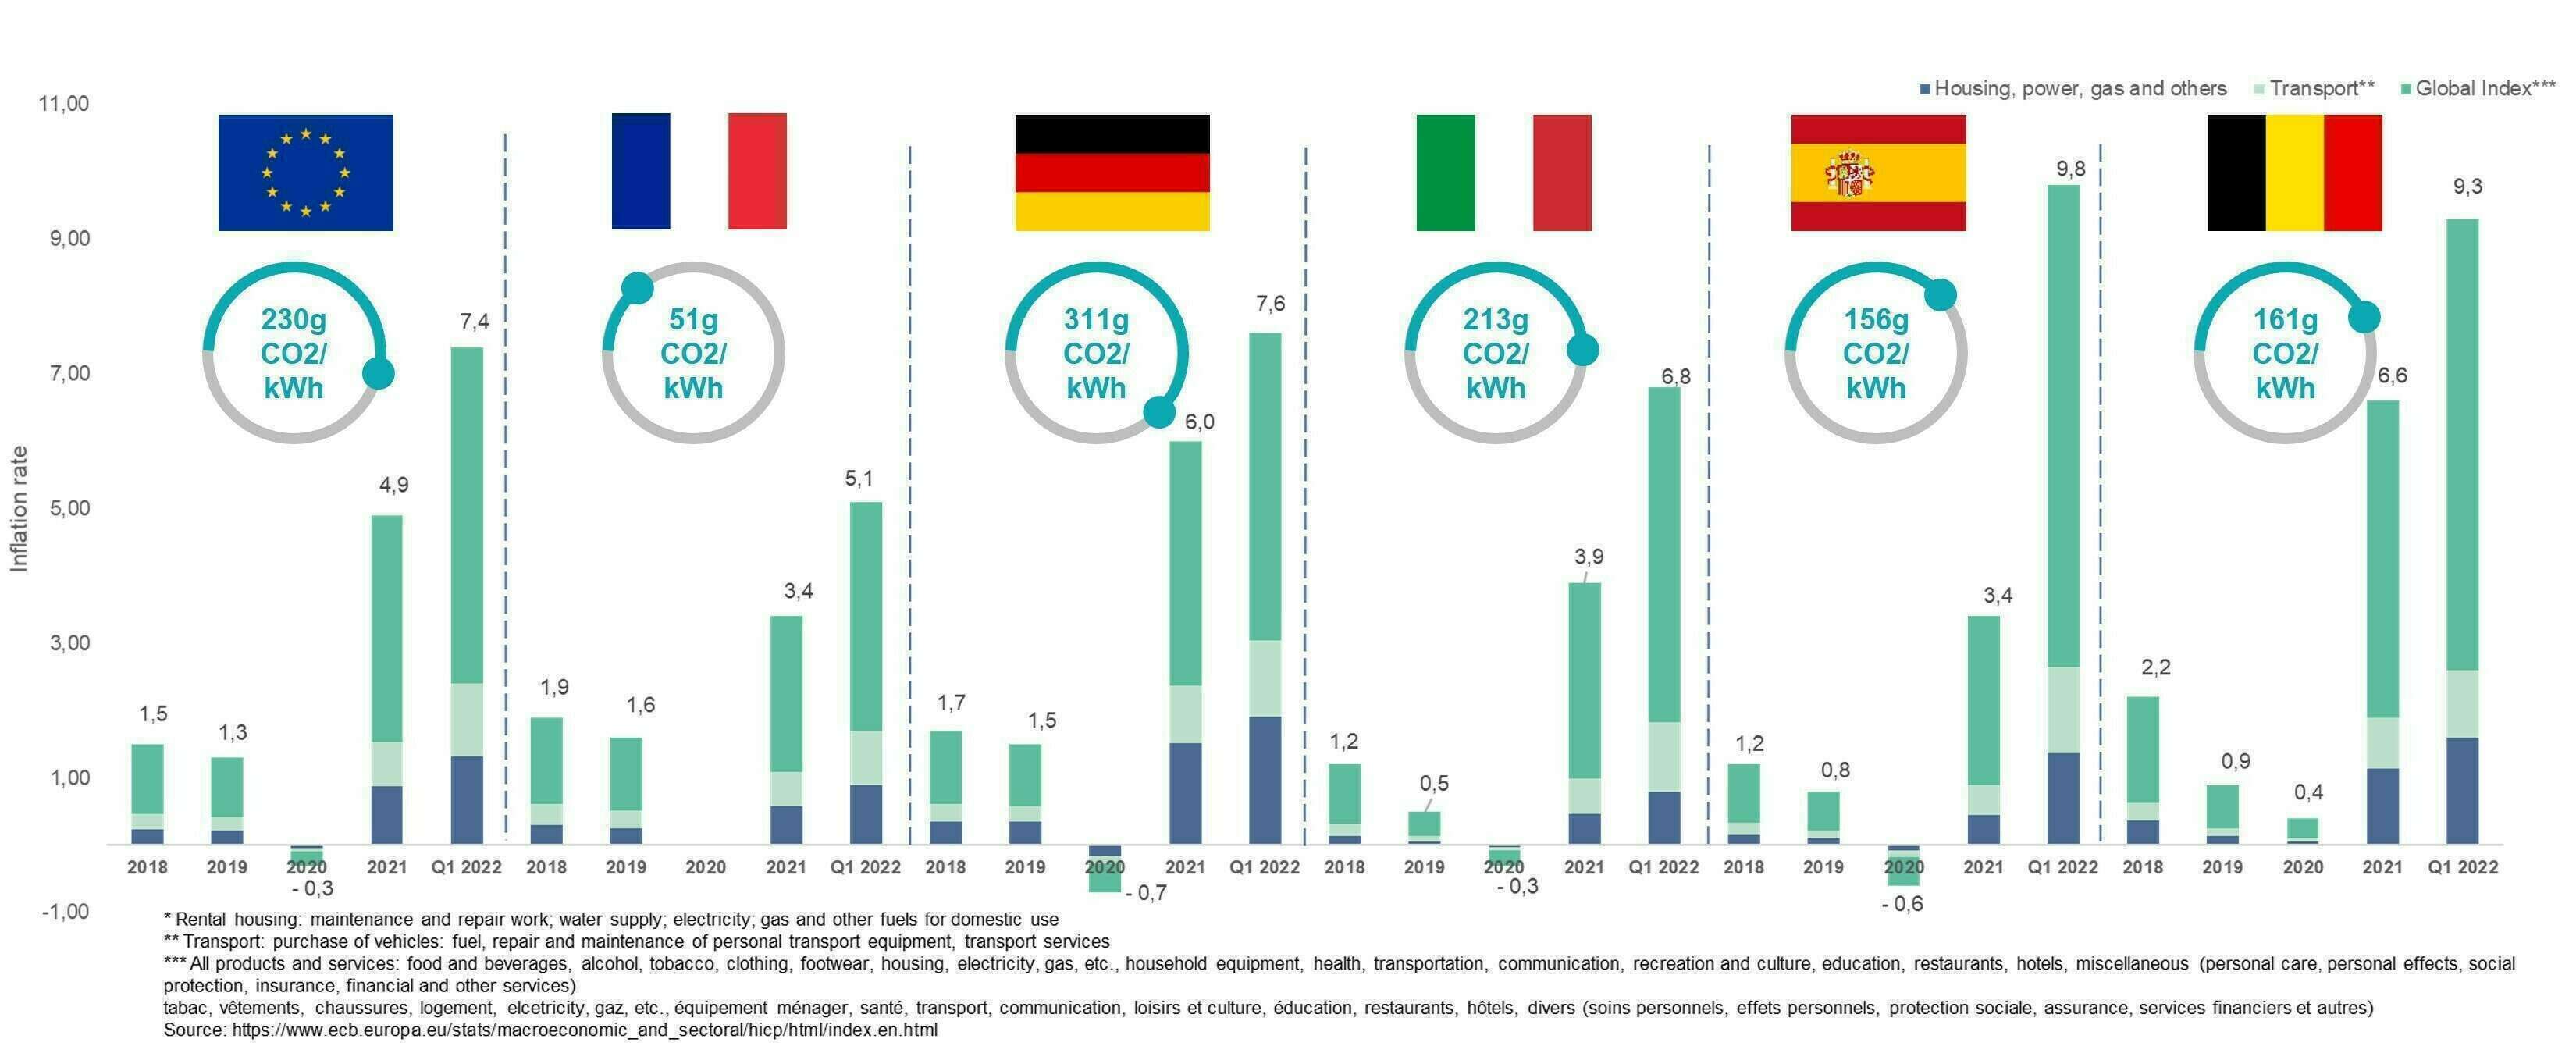
Source: Natixis from European Central Bank and EEA data
On electricity prices, one could argue that European Nations are interconnected through the continental electricity grid and therefore, there should not be any difference in electricity prices, which depends on the price of the last source of electricity called on the network (marginal cost). Nonetheless, one must distinguish electricity production costs from wholesale market prices. If reliant on gas, national electricity grids suffered increased production costs which in turns impacted consumers. Since France is heavily relying on the atom, gas prices increase had a relatively low effect on electricity production costs.
In France, where about two-thirds of power comes from Électricité de France’s (EDF) nuclear plants, the electricity component of inflation has risen by 4% in January 2022 compared to January 2021, versus an average of more than 27% in the eurozone generally [16].
Another measure explaining for such a difference in inflation compared to neighbor countries is the price shield on both electricity and gas prices. As part of Energy Regulation Commission (CRE) ruling on regulated electricity and gas prices the French government guaranteed that:
- In 2022, electricity regulatory price increase is capped at 4% [17]: by almost erasing taxes on electricity from 25.83€/MWh to 1€/MWh for households and obligating EDF to sell electricity below market price to competitors;
- And froze gas regulatory prices: at October 2021 prices from November 2021 until June 2022. They would have increased by 38% in January 2022 otherwise [18].
These mechanisms and the electricity mix structurally less dependent on fossil fuels are efficient in limiting electricity prices increase. Industry, transport and household heating are to blame for inflation in France.
In this context the carbon content of national electricity grids can be linked to electricity prices (Figure 7). Both sustainability and sovereignty considerations align with the fight against inflation (see our March article on The clash between sovereignty and sustainability?). Reduction of fossil fuel dependency would both serve the fight against climate change and against inflation all the while increasing countries’ strategic autonomy (Figure 8).
Figure 8: European gas imports from Russia: an extensive and differentiated dependency

Source: New York Times (March 2022), How a Ukraine conflict can reshape Europe’s Reliance on Russia
Fossilflation, Climateflation and Greenflation help identifying climate-related inflation drivers and solutions. This fossil fuel related inflation pushes for more investments in less carbon intensive technologies for heating, industries, transportation and electricity. Another unexploited lever might be even more powerful, demand-side mitigation.
2) Demand-side mitigation, the answer to the mismatch between supply and demand
In the fight against climate change, demand adjustments have been left aside for fear of social unrests (yellow jackets, Kazakhstan), yet it is where easy to abate and untapped GHG emissions remain.
As part of the Russian conflict, the European Union welcomed IEA’s recommendations on demand-side measures in its “10-Point Plan to Reduce Reliance on Russian Natural Gas” and “10-Point Plan to Cut Oil Use”:
- Reduce speed limits on highways by at least 10km/h
- Work from home up to three days a week
- Urge car sharing and practices that decrease fuel use
- Avoid business travel when alternatives exist
- Thermostat adjustment by consumers
Some of these demand-side measures have been endorsed both in the REPowerEU plan and discussed during the Versailles Summit in March. The 10th and 11th of March, EU Heads of State recalled in the “Versailles Declaration” that EU members should improve their food security collectively by reducing their dependencies on key imported agricultural products and inputs, including by increasing the production of plant-based proteins and implicitly reducing the consumption of animal proteins. The Commission is invited to present options to address the rising food prices and global food security issues.
In the meantime, during electricity demand peaks in 2021 and 2022, it was not uncommon for consumers to receive electricity consumption recommendations in France: around 16 times on the period (see below the example of RTE’s tweet, France power grid operator). Indeed, demand-side management has instantaneous and substantial effects to regulate electricity grids and cushion price increases.

On April 4th, 2022, after receiving text and radio messages as well as alerts on social networks, French consumers managed to voluntarily reduce their consumption to avoid power outages. Indeed, RTE assessed that the necessary power at peak was reduced by 800MW thanks to behavioral changes that day. This is not anything new as RTE established a regional alert system to prevent outages. On Christmas night 2021 for example, consumption was high in northern France and behavioral changes recommended [19].
More recently, in the week of May 9th, Texas power grid operator called “Texans to conserve power by setting thermostat above 78°F (25°C) and avoid usage of large appliances (such as dishwashers, washers and dryers) during peak hours” [20].
Even though these events are punctual, they show that there are margins for demand to adjust and provoke lasting effects on consumption patterns, to consequently reduce carbon emissions and cushion inflation.
The last IPCC report (AR6 WG3) on Mitigation of climate change demonstrates that a large amount of untapped carbon emission reductions to limit global warming to 1.5°C relies in behavioral changes.
Figure 9: Indicative potential of demand-side mitigation options by 2050
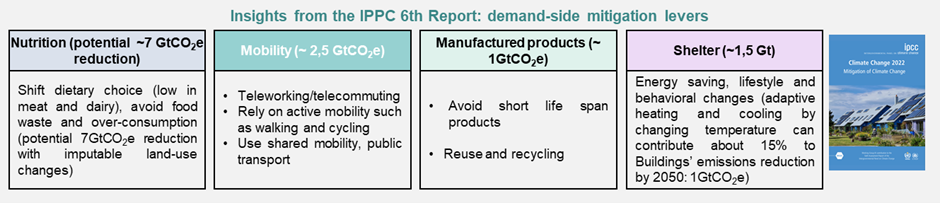
Source: Natixis, based on IPCC AR6 WG3 report
These demand changes have the power to substantially reduce GHG emissions from between 10 to 24 GtCO2/year approximately. For comparison, current emission levels are around 40 GtCO2/year globally and the remaining carbon budget from 2020 onward for keeping warming to 1.5°C with a 67% (50%) probability is about 400 (500) ±220 GtCO2 [21]. Pathways towards fulfilling the Paris Agreement and SDG 13 (Climate Action) involve global average per capita GHG emissions below around 5 tCO2eq by 2030 (for comparison, a French citizen annually emits around 9 tCO2e [22] and a US citizen around 20 tCO2e [23]). In demand-side mitigation lies a sizeable emission reduction potential.
Figure 10: Historic emissions, sources and remaining budget
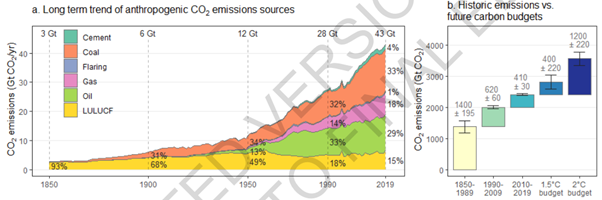
Source: IPCC, Climate Change 2022, Mitigation of climate change, available here
3) Value chain reshuffling through strategic positioning
One of the main causes of inflation is a mismatch between supply and demand. Supply shortages in 2021 and 2022 create pressures on oil & gas prices as well as food (wheat, vegetable oils) and raw materials (nickel, cobalt). On some of these, demand can adjust all the while benefitting to climate objectives: reducing oil consumption by promoting teleworking, reducing gas consumption by adjusting thermostats 1°C below average, shifting diets toward vegetable proteins freeing cereals and land for direct human feeding and forestry.
On the other hand, demand adjustment can reveal counterproductive for climate goals in some sectors such as renewable energy. Indeed, reducing demand for metals critical to the energy transition might end up delaying the transition. In that case, strategic positioning on specific value chains is necessary.
As an example, Tesla recently announced that nearly half of the cars produced during the 1st quarter of 2022 were equipped with critical metals free batteries: Lithium Iron Phosphate (LFP) batteries [24] which do not use nickel, cobalt nor manganese.
Other strategic positioning in the sector of renewable energies, batteries and electricity grids extension supply chains can help reduce the mismatch between supply and demand:
- Investment in recycling facilities to source metals from e-waste;
- Mining capacities to increase supply;
- Research and development of alternative materials.
These phenomena are complex and interrelated but strategic positioning in different sectors and activities can alleviate some of the risks inherent to climate-related inflation. It is not so much about a sector in particular but rather where in the value chains the bank or its clients could position itself to hedge against inflation. Meanwhile, inflation-linked instruments raise interest: Agence France Trésor [26] (the french treasury) issued the first Green Inflation- Linked Bond (See our newsletter article "A world's first for France and its green inflation-linked bond").
[1] BVA Group, Préoccupations des Français : Priorités et attentes à l’aube de l’élection présidentielle, available here
[2] ECB: A new age of energy inflation: climateflation, fossilflation and greenflation, Isabel Schnabel, March 2022, available here
[3] IEA: World Energy Investment 2021, June 2021, available here (p. 26)
[4] Aljazeera: OPEC fails to boost output as members face capacity woes, May 2022, available here
[5] IEA: Net Zero By 2050 : A Roadmap for the Global Energy Sector, October 2021, available here
[6] CESifo – Effects of Carbon Pricing on Inflation, Richild Moessner, February 2022, available here
[7] IEA - The role of critical minerals in clean energy transitions, March 2022, available here
[8] IEA: Net Zero By 2050 : A Roadmap for the Global Energy Sector, Oct. 2021, available here
[9] FAO: A Global Food Import Financing Facility (FIFF): Responding to soaring food import costs and addressing the needs of the most exposed, April 2022, available here
[10] IPCC: Climate Change 2022, Impacts, Adaptation and Vulnerability, March 2022, available here
[11] Khan et al., Rising Atmospheric Temperature Impact on Wheat and Thermotolerance Strategies, Nov. 2020, available here
[12] Euronext, Milling wheat futures prices, available here
[13] AFP, Wheat prices hit record high after Indian export ban, April 2022, available here
[14] ECB: A new age of energy inflation: climateflation, fossilflation and greenflation, Isabel Schnabel, March 2022, available here
[15] ECB, Inflation Dashboard, available here
[16] Eurostat, Databrowser, available here
[17] Administration française, available here
[18] Administration française, available here
[19] Ecowatt signal data, available here
[20] Forbes, It already feels like August in Texas, At least where the Grid’s concerned, available here
[21] IPCC: Climate Change 2022, Mitigation of climate change, available here
[22] Chiffres clés du climat, Ministère de la transition écologique, édition 2022 available here
[23] United Nations Environmental Program, Emissions Gap Report 2020, available here
[24] Iron man Elon Musk places his Tesla battery bets, Reuters, April 2022, available here
[25] Bureau of labor statistics, April 2022, available here
[26] Programme indicatif de financement de l'état pour 2022, Agence France Trésor, Dec. 2021, available here