Green Bond Funds' impact reporting: standardization remains a leitmotiv
15 - minute read
In January 2022, Environmental Finance[1] released its second annual report on impact reporting by Green Bond funds. How are impact reporting practices evolving alongside volume issuance? Are we heading toward more sophistication and/or standardization? Can Green Bond Funds managers influence the overall Green, Social, Sustainability and Sustainability-Linked (GSSS) bond market by setting minimum requirements at their end? Environmental Finance’s study provides an insightful benchmark gathering answers from a sample of 40 Green Bond Funds combining $29.5 bn AuM (out of 68 green bond funds identified[2]). According to Environmental Finance, a Green Bond Fund is one in which the share of Green Bonds shall be more than 50%. Natixis’ mapping of Green Bonds Funds is different, as we identified 120 fixed income funds presented as “Green”, that is to say investing primarily in bonds with green/environmental use of proceeds (all investment areas and base currencies; including 22 funds with a clear focus on “Climate”, “Transition” or “Carbon”). We classify in another category “Impact” or “SDG” bond funds, which are also investing in green bonds, and in other formats or sustainability-themes.
Figure 1 - Green Bond Funds identified by Environmental Finance - combined assets under management (AuM)

Source: Natixis, based on the Environmental Finance report available data
Key findings from Environmental Finance ‘s report
- 72% of the funds surveyed already produce impact reports and 15% plan to do so
- Nine out of ten investors regard impact reports as ‘crucial’
- Three quarters of the investors surveyed think that reporting practices in the green bond market are inadequate
- Half of investors suggest that poor reporting quality could impede or hinder further investments in Green Bonds
- More than 70% of green bond funds report on their alignment with the SDGs
Table 1: The Top 10 Green Bond Funds per AuM surveyed by Environmental Finance
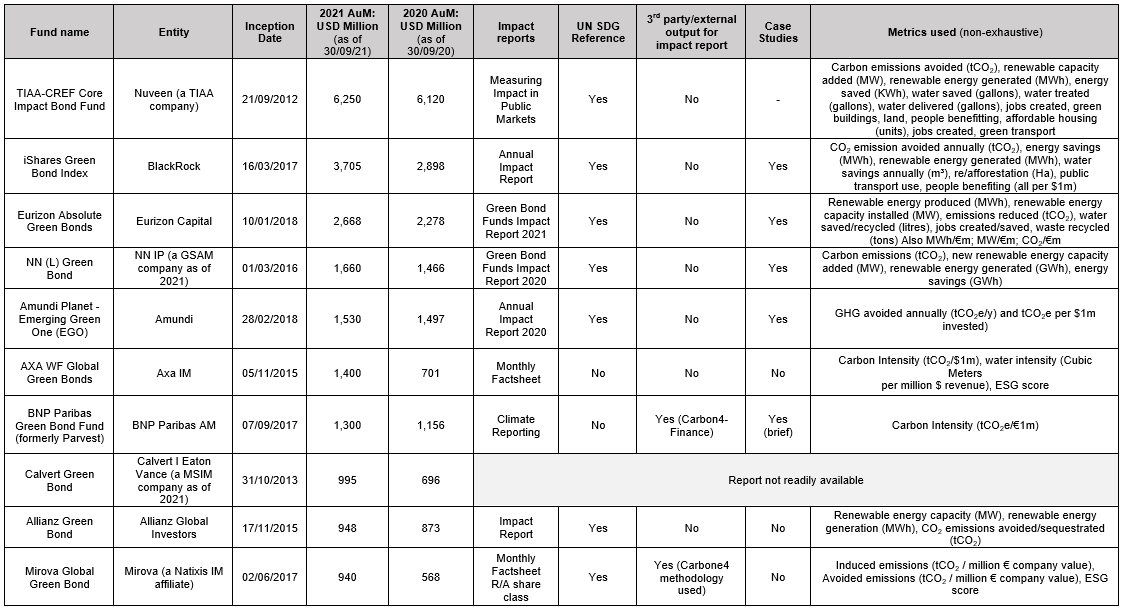
Source: Environmental Finance, Green Bond Funds Impact Reporting Practices 2021
Table 2: The Top 10 Green Bond Funds per AuM surveyed by EF with clickable link towards their impact reporting
|
Fund name |
Impact reports |
|
Report not readily available |
|
|
Impact Report |
|
Source: Environmental Finance (EF), Green Bond Funds Impact Reporting Practices 2021
The dramatic growth of the green bond market and its impact on Green Bond Funds
The data on outstanding amounts and the impact report reviewed by Environmental Finance relate only to the nine first months of 2021 (until 30 September). During this period new issuance of Green Bonds totalled $388 bn[3] (versus less than $300 bn for the whole of 2020). Meanwhile, Green Bond Funds assets under management soared by 31% to $34 bn from $26 bn for the period in question. This is due not only to fundraising but also to the creation of new funds throughout 2021. Indeed, according to our own statistics, we account for the creation of 24 green funds during the year, or 20% of our current sample of Green Bond Funds.
Figure 2 (left) - Evolution of AuM in $bn in the surveyed Green Bond Funds
Figure 3 (right)- Evolution of the number of Green Bond Funds
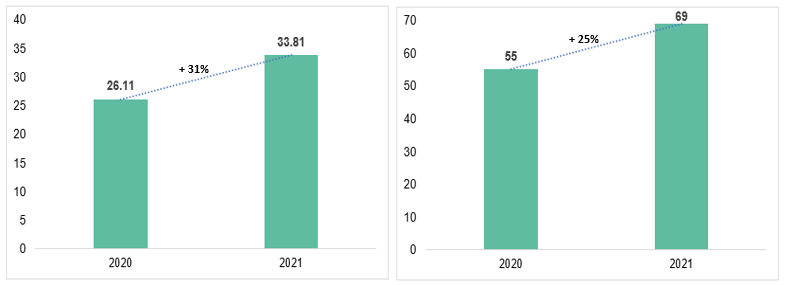
Source: Natixis, based on the Environmental Finance report available data
The growth rate may be sustained in the near future by the launch of new Green Bond Funds. Since the end of September 2021, we have observed the launch of no less than 14 new Green Bond Funds, again not including “Impact” and/or “SDGs” bond funds.
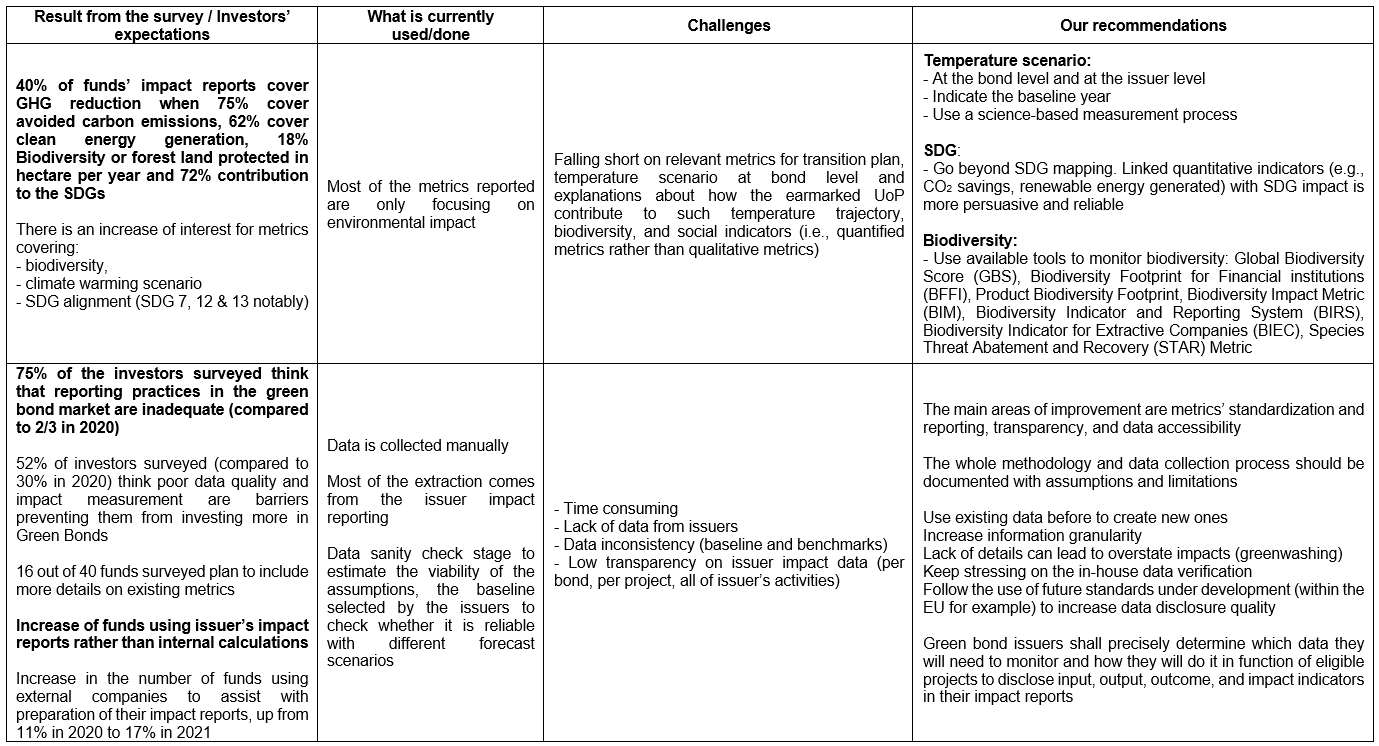
This appetite has raised expectations regarding green bond issuers’ impact reports notably because Green Bonds Funds are meant to provide their own impact reporting (72% of the funds surveyed already produce impact reports). Likely to meet such demand, issuers began to publish more data. The share of Green Bonds Funds using internal calculations has decreased between 2020 and 2021 (almost 70% of green bond funds rely on bond issuers’ impact data against 40% in 2020). Despite that data sourcing change, Environmental Finance discerns improvements to be done and notes rising concerns on the overall impact reporting quality.
Investors’ expectations are not met by issuers
The survey revealed a mismatch between impact report practices and bond holders’ expectations. While more than 90% of investors regard impact reports as ‘crucial’, 75% of them currently view impact reporting practices as inadequate. Noticeably, half of them suggest that poor reporting quality could impede or hinder further investments in Green Bonds (see figure 5 below).
Figure 4 – Main challenges stated by Green Bond Funds Managers regarding issuer impact data aggregation

Source: Environmental Finance, Green Bond Funds Impact Reporting Practices 2021
Figure 5 – Challenges or barriers preventing investors from investing more in Green Bonds or Green Bond Funds

Source: Environmental Finance, Green Bond Funds Impact Reporting Practices 2021
The report highlights an increased use and/or emphasis on the UN Sustainable Development Goals (UN SDGs) with 70% of the funds surveyed reporting on their alignment with the SDGs. Surveyed investment firms expressed concerns over the robustness of SDG alignment claims, notably due to the paucity of information disclosed. The use of the SDG remains superficial and often result in cherry-picking practices. The SDGs are so indivisible, interlinked and tied to local contexts that they require specific geographic, political, economic, social and environmental reporting. Therefore, it is even more complex for Green Bond Funds to quantify and isolate their investments’ contribution.
To improve SDG contribution claims, which is not necessarily relevant in the context of Green Bonds, we, at Natixis, have put forward guidance to go further than mere mapping against the stickers[4]. We are assisting Public Development Banks in their endeavor to align with the SDGs[5].
Figure 6 – Three shades of SDG approaches
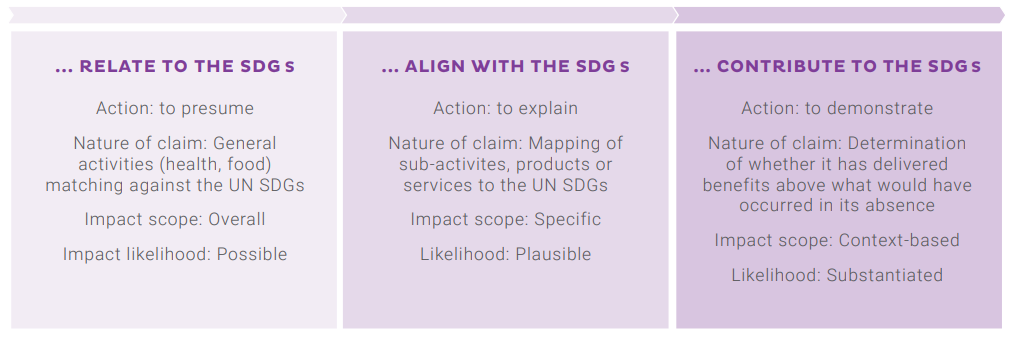
Source: Natixis GSH, Solving Sustainable Development Goals Rubik’s Cube
The SDG contribution chain must be explicit and describe how the actions or companies financed by specific investment trickle down to make an ultimate impact on the SDG target.
Figure 7 – Example of a tramway line contributing to the SDG target 11.2.1
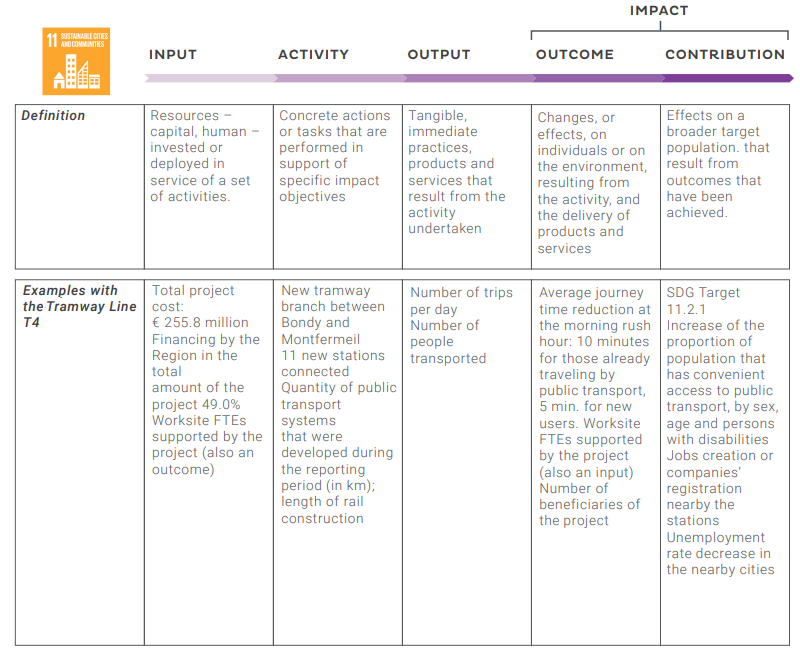
Source: Natixis GSH & Region Ile-de-France, extract from “Solving Sustainable Development Goals Rubik’s Cube”
The most widespread metrics
One can notice that “GHG reduction” metric presence dramatically dropped while “carbon emission avoided” enjoyed a significant increase (see figure 8 below). This raises questions as the latter metric is fraught with underlying hypothesis (notably on the baseline) and less clear cut than reduced emissions (indeed avoidance is highly relevant for so-called enabling activities).
Although most of the metrics relate to GHG emissions, there is an increase in metrics covering biodiversity and forest land protection (increase from 10% in 2020 to 18% in 2021). As analyzed in table 7, the identification of appropriate indicators for biodiversity at the corporate and site-levels is a fundamental challenge in impact reporting. Some methodologies are under development[6]. One can think of the methodology “Biodiversity indicators for site-based impacts” developed by UN Environment Programme (UNEP) and World Conservation Monitoring Centre (WCMC)[7].
Among other hurdles, one mentions challenges around impact proportionate attribution (whether is it relevant, doable for all metrics and indicators). Attribution and impacts aggregation create methodological challenges, in particular to assess portfolios temperature scenario alignment.
Temperature alignment seems to be the “go to” metric for many actors. Yet, discrepancies exist between methodologies at asset, product entity or portfolio levels. Articulating temperatures is challenging.
Temperature alignment can be understood in many ways. But scientifically, it is a dynamic process in which a determined level of global year-on-year absolute emission reduction guarantees a limitation of temperature increase to X°C with a certain probability. One must therefore distinguish the scientific notion and its operationalization by financial and non-financial actors.
If portfolio temperature alignment proprietary methodologies are laudable and allow to operationalize and assess one’s progress, it can hardly be called scientific and standard as a certain number of proxies and hypotheses make them incomparable. In March 2022, the Science Based Target initiative (SBTi) is set to publish its Science-Based Net-Zero Target Setting in the Financial Sector standard. In its draft version, the SBTi explores how Financial Institutions (FIs) can reach net zero through different approaches including:
- Portfolio alignment: each individual asset achieves a state of net-zero consistent with the SBTi Corporate Net-Zero Standard.
- Both financing decarbonization activities and explicitly reallocating financing activities to climate solutions at a rate consistent with global climate goals.
In the case of green bond funds, each individual asset presumably contributes to build a low-carbon economy. Yet, investment in green assets does not necessarily ensure the replacement of more polluting ones, de facto reducing global carbon emission at the pace needed to limit global temperature increase to X°C.
Taking a step back, an entity can act on both levers, replace polluting assets by investing in low carbon ones. This strategic move could be synonymous to a yearly reduction of an entity’s carbon footprint consistent with an X°C pathway and be slightly more relevant (see our articles this month on net-neutrality “To pledge or not to pledge… Net neutrality, an international dilemma” and ”ADEME’s warning and guidance on carbon neutrality claims following AMF’s conclusions on carbon neutrality").
One particularly wonders whether temperatures could and should be aggregated at all levels and be proportional to investment and ownership.
Figure 8 – Environmental metrics covered in impact report for surveyed funds
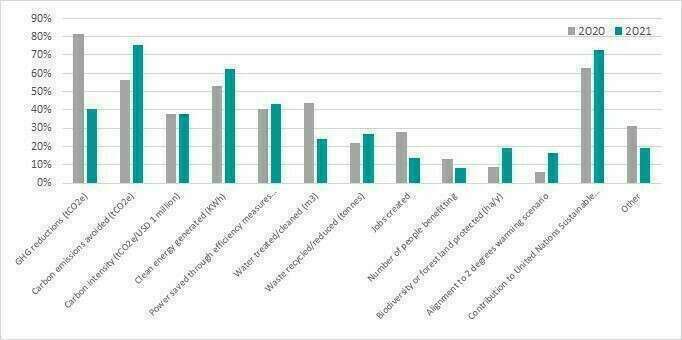
Source: Environmental Finance, Green Bond Funds Impact Reporting Practices 2021
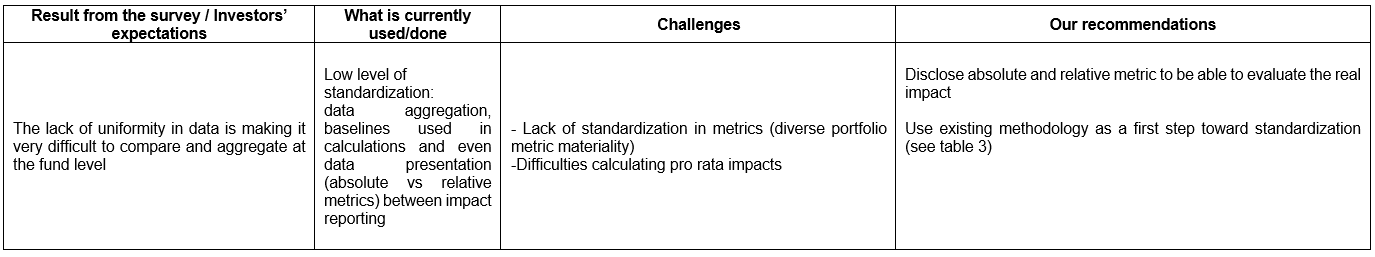
In parallel, only little progress has been achieved on standardization and methodologies disclosures of impact reporting, despite pressures from investors, industry associations and regulators for better disclosure of sustainability data on investment products.
Towards more heterogeneity with highest penetration from social and sustainable bonds?
The study predicts that the fragmentation of the impact reporting landscape could become wider as six out of ten green bond funds are now also able to invest in social or sustainability labelled bonds for which the impact calculations raise further difficulties. We delved into social bond issuers’ current reporting practices and highlighted areas of improvement in our study The “Art” of Social Bond Impact Reporting.
Demonstrating the social impact and additionality of an investment is more than a technical challenge. In contrast to GHG emissions or other environmental indicators, usually related to physical and chemical metrics (rather mechanical causation chains), social indicators generally tend to be of a more qualitative nature and impact attribution is complex. In that respect, it will be interesting to look at the impact reporting proposed by the recently launched Social Bond Funds (Amundi at end-2020, Schroders, BNP Paribas AM or AXA IM in late 2021 and early 2022), on top of historic Social Bond Funds’ range managed by Columbia Threadneedle Investments [8].
All these problems raised the question of impact reporting standardization by bond issuers, to in fine facilitate the difficult task of aggregating impact data across their portfolios.
Transparency and standardization as main hurdles
Data collection is one of the cornerstones of fund level reporting and is still predominantly a manual and time-consuming process (see our analysis in table 4). There are some database and third-party solutions emerging, but the majority of impact data must be extracted from issuers’ impact reports. In these conditions, the very little sign of standardization in terms of format, frequency, detail, and data metrics can create headaches for funds’ managers (see our analysis in table 5 and 6). These challenges in data gathering and aggregation have led to the growth of third-party impact reporting products and some green bond funds employ an external company to gather, aggregate and produce their impact report. As one can notice in the top 10 Green Bonds Funds per AuM surveyed (see table 1), two funds are reviewed by third external party such as Carbon4.
Figure 9 – How is the data for impact report gathered (funds surveyed)?
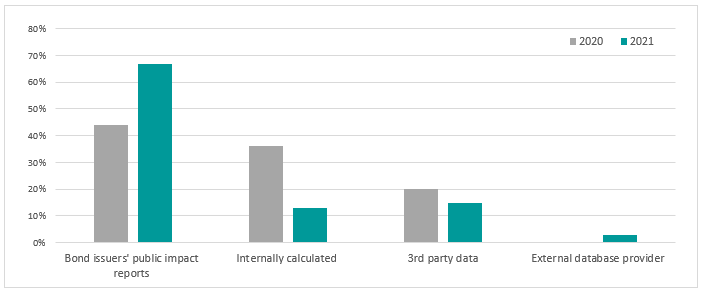
Source: Environmental Finance, Green Bond Funds Impact Reporting Practices 2021
Reporting guidance and standards
Several voluntary standards have been proposed, by various UN agencies and others, to guide green bond issuers in the harmonization of reporting. The ultimate goals of these proposals are to set expectations, drive consistency, and eventually, drive comparability across investments.
In its paper, Environmental Finance references several initiatives to be used by organizations seeking to optimize their positive contribution, promote impact integrity and avoid impact washing.
Table 3 – Examples of standards around impact reporting
|
Document / reference |
Author/Sponsor |
|
ICMA |
|
|
OECD & UNDP |
|
|
IFC |
|
|
IMP Network |
|
|
UNEP FI |
|
|
UNEP FI |
|
|
Sustainable Development Goals (SDGs) Impact Standards for Bond Issuers |
UNDP |
|
The Generation Foundation, UNEP FI PRI |
|
|
Partnership for Carbon Accounting Financials (PCAF) |
|
|
European Commission |
|
|
InterAmerican Development Bank |
Source: Environmental Finance, Green Bond Funds Impact Reporting Practices 2021
What to expect from the European Green Bond Standard regarding impact
In November 2021, we published an analysis of the European Green Bond Standard (EUGBS) proposal made by the Commission. Amendments from the European Parliament are under discussion. The latest draft (Article 10 of the Standard)[9] incorporates additional requirements regarding impact reporting:
- Individual bond reporting (not portfolios reporting)
- Disclosure requirements applicable to all Green Bonds issuers (encompassing taxonomy alignment ratio of the UoP), somehow making the Standard compulsory (including for issuances that follow private/industry standards such as the ICMA or CBI, as well as SLB, which is odd)
- A compulsory external review of the impact report (analysing whether the bond issuance aligns with the broader sustainability strategy of the issuer, the transition plan of the issuer outlining how it will align to a 1.5°C global warming scenario and reach climate neutrality by 2050; an annual review of taxonomy-alignment plan and progress for specific UoP; the impact metrics)
One notices the emphasis on the overall sustainability strategy and the sustainability impact of the bond’s use of proceeds (with specific template in the Annex III of the European Green Bond Standard[10]). The Regulation and aforementioned amendments are still under negotiations, but they could significantly transform the impact reporting practices.
What is next? Towards what types of SLB reporting practices?
Impact reporting practices in the context of Green Bonds are still at an early development stage, but many initiatives are emerging without one taking the lead for the moment. Europe, via the ESMA, will have to propose a reporting standard that is both complete and clear if it wants its taxonomy to remain the leader in sustainable finance (see our article this month “Greenwashing as a cornerstone of ESMA’s newly released Sustainable Finance Roadmap”).
In the context of the growing green bond market, and legitimate concerns over greenwashing, impact reporting practices must become robust, sophisticated, reliable, and comparable. The success of Sustainability-Linked Bond partially lies in their “impact by design” nature, both in their layout by relying upon quantitative metrics that unarguably reflect the impact an issuer has, and in the mechanism, as there is an incentive or consequence (a causal element around sustainability performances delivering).
We need both standardization, but also innovation and creativity, i.e. a greater number of metrics or at least new ones addressing ignored themes. This is the case with sequestered CO2, biodiversity impacts of products/companies or social impacts (see our analysis in Table 7). Anyway, the continued increase in interest for sustainable finance, which is moving from the niche to the mainstream, will require a phase of practices harmonisation at all levels.
The surge of Sustainability-Linked Bond issuance aforementioned will also require impact reporting creativity. One does not expect the mere release of the SPT and their audit by third parties. SLB will bring us to the next phase, interpretating “impact data”, from an ambition, best in class and/or alignment standpoint, but also from a deciphering underlying drivers’ perspective as well.
Table 4: Main findings of the survey: Data collection
Source: Natixis GSH
Table 5: Main findings of the survey: Data (Dis)Aggregation
Source: Natixis GSH
Table 6: Main findings of the survey: Data Presentation
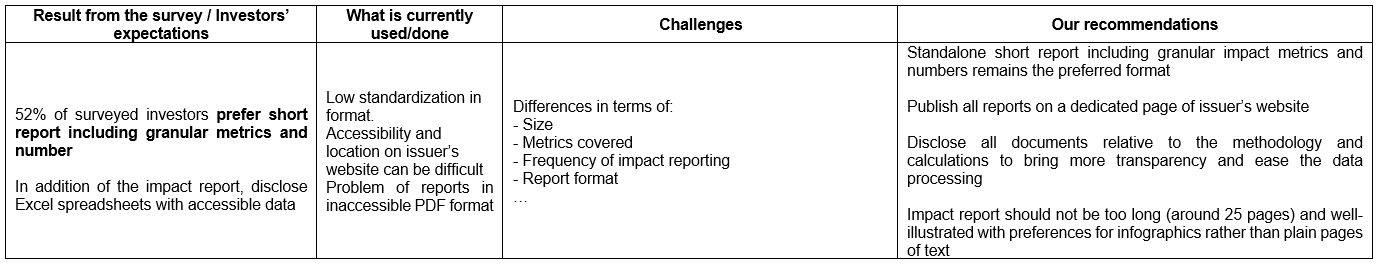
Source: Natixis GSH
Table 7: New frontiers
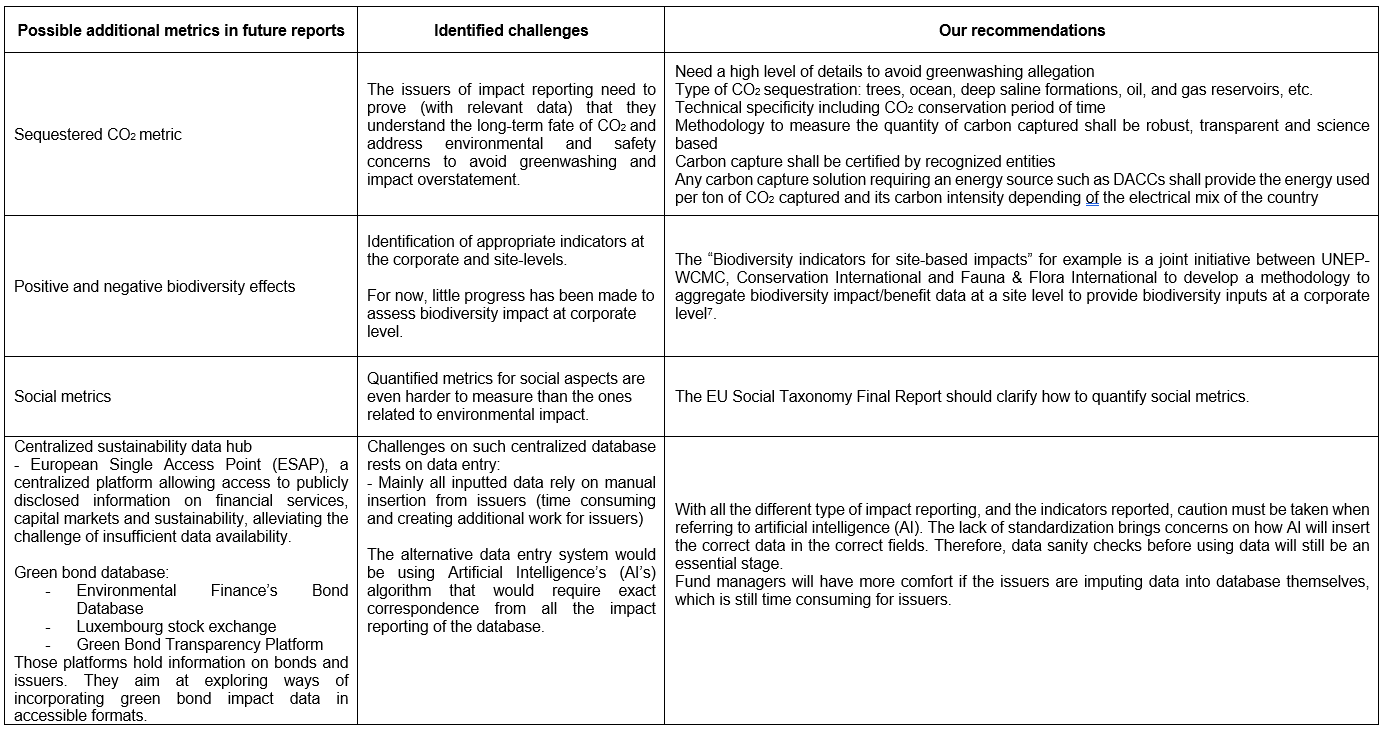
Source: Natixis GSH
To go further:
- Environmental Finance Green Bond Impact Reporting, available here
- The Nordic Position Paper on Green Bonds Impact Reporting, available here
- CBI, Post-issuance reporting in the green bond market 2021, available here
- UN Environment Programme, WCMC (World Conservation Monitoring Centre) - Biodiversity indicators for site-based impacts, available here
[1] Environmental-Finance.com is an online news and analysis service established in 1999 to report on sustainable investment, green finance and the people and companies active in environmental markets.
[2] In the initial universe of 68 funds, 19.9% of AuM was from North America, 64.4% from Europe, 5.2% from Asia (excluding-China), 1.4% from China, 4.9% from emerging markets (excluding-China).
[3] For 2021, Green Bonds issuance has reached $482.3 bn (Natixis, Market Data)
[4] See our first flagship report, “Solving Sustainable Development Goals Rubik’s Cube”, published in September 2018.
[5] See the press release “IDFC appoints Natixis CIB to develop a SDGs alignment framework for public development banks”, published in October 2021
[6] See our previous articles, “Towards a Task Force for Nature-related Financial Disclosures and investors’ appetite for science-based targets on natural capital” and “From Marseille to Kunming: Noah’s Ark for biodiversity?”
[7] UN Environment Programme (UNEP), World Conservation Monitoring Centre (WCMC) - Biodiversity indicators for site-based impacts, available here.
[8] See Threadneedle UK Social Bond Fund’s 2021 annual impact report, available here. Its Impact Assessment Methodology is made of indicators around social outcomes (regarding primary outcome such as provision of transport infrastructure and secondary outcome with job creation), social geography (analyzing the bond’s geographical footprint that benefits disadvantaged communities) and social intensity (the extent to which the bond directly targets people and communities most in social need).
[9] Proposal for a Regulation of the European Parliament and of the Council on European Green Bonds, available here
[10] Annexes to the Proposal for a Regulation of the European Parliament and of the Council on European Green Bonds, available here. Content of the pre and post issuance reviews are explained in Annex IV of the Proposal.