Climate is dead, long live biodiversity
2022 ended with COP15 propelling the world on the path to halt and reverse biodiversity loss. 2023 is set to be a decisive year for biodiversity as many agenda coalesce to make biodiversity the pivotal sustainability theme of the year. Will sustainable finance undergo necessary transformations to allow biodiversity-related considerations to become mainstream?
This is our conviction, hereafter developed.
Content
1. COP 15’s butterfly effect
2. Biodiversity mirroring climate efforts…
3. ... Yet with major differences
4. The way forward for sustainable finance
COP15's butterfly effect
If COP15 did not solve the universal challenge of providing a unique metric for all businesses to monitor their biodiversity impact, it succeeded in putting a straight forward target for the world to achieve: halt and reverse biodiversity loss. It has to be seen as the equivalent of limiting global warming to 1.5°C.
On the 19th of December 2022, 193 countries agreed upon 4 long-term goals for 2050 and 23 targets to be reached by 2030. It gave birth to the global biodiversity framework at COP 15. The cornerstone of the agreement would be the protection of 30% of the planet surface and ensuring that 30% of degraded ecosystems are under restoration by 2030. As of today, only 17 % of land and 8 % of marine areas are under protection[1].
The framework responds to the Intergovernmental Science-Policy Platform on Biodiversity and Ecosystem Services (IPBES, the equivalent of the IPCC on biodiversity matters) and other scientific documents which describe the state of nature and actions needed to halt and reverse biodiversity loss. Results of the COP15 negotiation are the political translation of scientific recommendations.
Even though the above-described target is global, it can be adjusted at the level of each value chain (as for climate and carbon neutrality) in order to guide companies’ actions. As such, the table below illustrates how COP15 targets may impact the private sector through national or regional regulations, taking the European Union as an example. Before COP15, the EU had already set targets in line with the global biodiversity frameworks. To do so, we selected 8 of the 23 “COP15” most material targets for companies and classified them according to a methodology Natixis CIB Green & Sustainable Hub has developed toward nature positive contributions with 5 nature positive contribution levers (Reduce pressures, Protect, Restore, Offset, Contribute, described further below) as detailed in the figure 1.
Figure 1: 5 levers toward nature positive contributions

Source: Natixis CIB GSH
|
COP 15 Targets |
Natixis nature contribution levers |
Implications for companies |
Usability for companies |
Integration in EU laws |
|
Target 1 Reduce to near zero the loss of areas of high biodiversity importance |
Companies’ value chains which depend on biodiversity hotspots might be impacted by increased regulations |
Companies could assess, disclose and mitigate or exclude direct or indirect exploitation in areas of high biodiversity importance and provide full transparency on their value chains (using geospatialisation tools) |
Both EU biodiversity strategy to 2030 and the regulation on imported deforestation contribute to that objective although it is not stated as such |
|
|
Target 2 Ensure that by 2030 at least 30% of areas of degraded terrestrial, inland water, and coastal and marine ecosystems are under effective restoration |
Restore |
Businesses which contributed or contribute to land degradation might be impacted by or be part of national restoration measures. |
For relevant sectors (mining, agrifood, construction, transport etc.), set 2030 targets in line with the global target to restore 30% of degraded areas in their value chains |
Nature restoration law The EU has a target to put 20% of land and sea areas under restoration by 2030 |
|
Target 3 Effective conservation and sustainable management of at least 30% of the world’s lands, inland waters, coastal areas and oceans |
Protect |
Companies can contribute through sustainable management and conservation objectives alongside or within their value chains |
Businesses can assess the land intensity over their value chains (m²/€ of revenues or else), absolute land use (in m or ha) and reduce both on a pathway to reach a target in line with global objectives |
The EU has the same target enforced in its Biodiversity strategy to 2030 |
|
Target 7 Reduce by half both excess nutrients and the overall risk posed by pesticides and highly hazardous chemicals, working towards eliminating plastic pollution |
Reduce pressures |
Companies will be impacted by national regulation limiting the use of pesticides of chemicals on their premises and more globally in their value chains. |
Relevant companies could set a 50% reduction target on the use of fertilizers, pesticides and highly hazardous chemicals by 2030 on their entire value chains
Setting targets on plastic wastes elimination by 2030 on their entire value chains (plastic recycling rate and infrastructure financing) |
Sustainable Use of Pesticides Directive Farm to Fork Strategy The target for the EU is the same |
|
Target 15 Require large and transnational companies and financial institutions to monitor, assess, and transparently disclose their risks, dependencies and impacts on biodiversity through their operations, supply and value chains and portfolios |
Monitor |
Regulation on biodiversity-related disclosure will require companies to collect and disclose more data on biodiversity. |
Companies already report biodiversity related KPIs when relevant (solid waste, water consumption etc.). Nonetheless, this target might lead to more requirements in global regulatory environments with thresholds (taxonomy-like) and the adoption of more synthetic indicators. |
EU biodiversity strategy CSRD / SFDR |
|
Target 16 Cut global food waste in half and significantly reduce over consumption and waste generation |
Reduce pressures |
National or regional laws (Garot law in France) might require companies to reduce food waste through food aid. |
Agrifood companies already monitor food waste, some of them have used related goals in Sustainability-linked bond’s structuration. |
Farm to fork strategy
European green deal |
|
Target 18 Progressively phase out or reform by 2030 subsidies that harm biodiversity by at least $500 billion per year |
Reduce pressures |
Companies benefitting from subsidies potentially harmful for biodiversity could see a revenue stream disappear. |
As part of that global effort, companies and financial institutions might identify the potentially harmful activities they finance. Minimizing negative impacts on biodiversity and incentivizing positive ones might entail in capital allocation arbitrages. |
_ |
|
Target 19 Mobilize by 2030 at least $200 billion per year in domestic and international biodiversity-related funding from all sources – public and private |
Restore/ Contribute |
|
A company could engage on biodiversity positive funding alongside a its value chain related to ecosystem services it depends on for example. |
Nature restoration law
A share of EU budget for climate action will be invested in biodiversity and nature-based solutions. |
|
Target 19 (d) Stimulating innovative schemes such as payment for ecosystem services, green bonds, biodiversity offsets and credits, benefit-sharing mechanisms, with environmental and social safeguards |
Offset |
Companies will have to leverage biodiversity-related financial tools to avoid, reduce and/or compensate for the biodiversity loss they generate. |
Capital markets and financial institution will have to consider biodiversity offsets or credits and integrate biodiversity-related topics further. |
The Farm to Fork Strategy alongside with the Common Agricultural Policy are set to incentivize practices which improve carbon stocks and restore biodiversity.
|
Biodiversity mirroring climate efforts...
As done for climate change mitigation, pathways to halt and reserve biodiversity loss can also be established on a global scale – see Figure 2.
- The left-hand side graph represents a pathway to halt biodiversity loss by 2030 (green line) compared with a business-as-usual scenario (red line) using the Mean Species Abundance metric (MSA).
- The right-hand side showcases the levers to activate according to the 3 Rio+20 scenarios in order to halt biodiversity loss all the while reaching sustainable development goals[2]. Three societal pathways are identified to reach such goals: (i) technological improvement in agriculture, (ii) more protection measures and (iii) strong demand-side management measures and consumption reduction. As for climate, societal choices are ahead and nations as much as companies must make choices in a whole-of-society approach.
Several measurement methods are being used to model such pathways at entity level. The European Commission[3] benchmarked around 40 of them to help businesses and financial institutions monitor their impacts and dependencies on biodiversity with a life-cycle analysis approach.
Figure 2: Measures in the alternative pathways that contribute to biodiversity goals
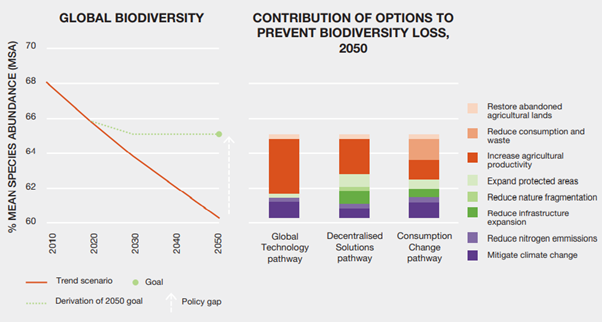
Source: The Global assessment report on biodiversity and ecosystem services, IPBES, 2020.
... Yet with major differences
CO2e is a synthetic indicator accounting for the warming potential of different greenhouse gases (CO2, CH4, N2O). It is fungible, highly material, comparable and can be monitored at many different scales from the earth system to households. These characteristics make it the best suited tool for companies to engage on climate change mitigation.
Measuring biodiversity impact is nowhere that simple because of the complex nature of the topic. Unlike climate change where an almost linear relationship between CO2 concentration in the atmosphere and the increase in global temperatures exists, multiple drivers are pushing biodiversity loss.
The most dominant drivers of biodiversity loss (figure 3) are:
- The conversion of natural ecosystems to suit human needs i.e., land use change (agriculture inducing deforestation, mining activities, artificialization for construction purposes, etc.);
- Direct exploitation (resource extraction such as, water withdrawals or minerals extraction);
- Three other drivers including climate change, pollution and invasive species add to the complexity of biodiversity loss[4].
Figure 3: Dominance hierarchies of the five direct drivers of biodiversity loss
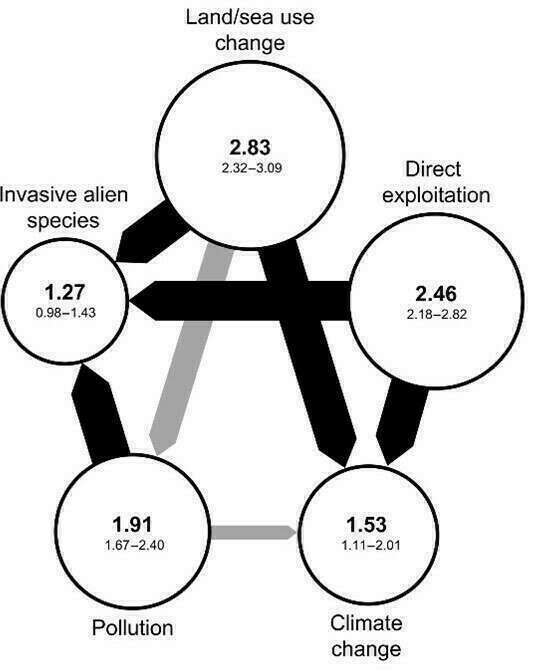
Source: Jaureguiberry et al., The direct drivers of recent global anthropogenic biodiversity loss, Science Advances, 2022.
The willingness to come up with a set of biodiversity metrics, that are fungible and comparable across companies and sectors has stifled broader biodiversity-related engagement. Such metrics are under development and consensus is growing on their underlying hypotheses and usage. Some companies have been waiting for such metrics, delaying action but they still have room to improve their biodiversity-related strategies and contribute to halt and reverse biodiversity loss.
Biodiversity disclosure and target setting standards are multiplying (TNFD, ISSB, GRI, SBTN, CISL, ECB guide) and 2023 is packed with guideline publications. The first release of a science-based targets for nature standard (SBTN, the equivalent of SBTi for climate) is set for early 2023.
SBTN is one of the useful guidance available. It provides a 5-step approach toward biodiversity target setting:
1. Assess;
2. Interpret and prioritise;
3. Measure, set and disclose;
4. Act;
5. Track.
To help in the process, the SBTN provides a Sectoral Materiality Tool (available here), a sector materiality analysis per ISIC – NACE – GICS codes of most material pressures per sector. It is based upon scientific literature collected to develop the ENCORE (Exploring Natural Capital Opportunities Risks and Exposure) impacts database (available here).
For the construction sector for example, most material impacts on biodiversity regard the following pressures:
- Climate change: upstream GHG emissions referring to material sourcing and production (ex: cement)
- Terrestrial ecosystem uses in direct operations relative to soil artificialization
From that materiality analysis, relevant indicators to monitor and engage on how to halt and reverse biodiversity loss could be CO2e emissions (already addressed by the SBTi ) and soil artificialization in hectare (or in economic intensity € of revenues / ha). To meet that goal, a company could engage in building only on land that has already been artificialized aiming at net zero artificialization by 2030 for example.
Several levers to mobilize – complementary to those identified for the low-carbon transition [5]– towards “a nature positive” contribution can be identified:
Figure 4: 5 levers toward nature positive contributions
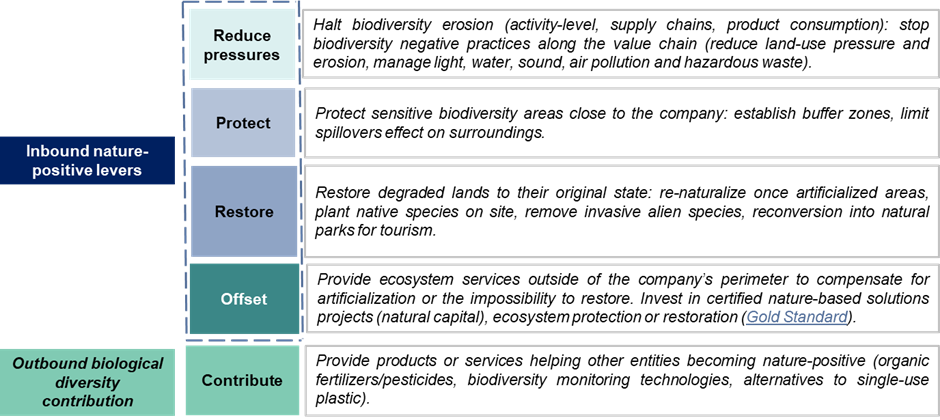
Source: Natixis CIB GSH
Coming across several practices at company level, one of the corporates we looked at that came across as one of the most advanced in integrating biodiversity footprint measurement in daily operations would be Holcim, the cement producer.

In cooperation with the International Union for Conservation of Nature (IUCN), Holcim, the cement company, established a Biodiversity Indicator and Reporting System[6] (BIRS) to help cement companies monitor and evaluate changes to biodiversity over time on their landholdings.
BIRS relies on a classification system that can be applied across geographical settings and implemented by non-experts, it is complemented with site level monitoring on sites of biodiversity importance.
The overall goal of such a system is the annual calculation of a biodiversity condition index for each of a company’s extraction sites, combining annual assessments of the extent and condition of the habitats within the site. The calculation of this index summarizes the composite value of the company’s landholdings for supporting biodiversity. Site-level indices can be aggregated for reporting at the country, regional and global levels, and ultimately for setting company-level biodiversity targets expressed through Key Performance Indicators (KPI).
Holcim intends to report and drive its impact on biodiversity on all its sites worldwide by the end of 2024[7]. By that time, it will be able to set an objective at company level on the path to halt and reverse biodiversity loss.
The Mean Species Abundance metric, a must have?
Most advanced companies might be establishing synthetic views of their value chains’ impacts on biodiversity. Model-based biodiversity footprints are imposing themselves as mainstream using MSA or other metrics (Global Biodiversity Footprint, Product Biodiversity Footprint…). They are building on data collected by companies for decades (water use, pesticides use, pollutants discharged, wastes volumes etc.). Although models to establish correlation between a pressure and its impact on the environment are not accurate, they provide a useful proxy for an entity to monitor, operationalize and drive biodiversity-related decision making.
An indicator is emerging as the mostly used one as it allows to conciliate global objectives with local realities and can be used by economic actors to drive their impact on biodiversity: the mean species abundance metric (MSA).
The MSA is an indicator of biodiversity intactness on a given territory. It can be established in two ways:
- By computing/estimating an MSA based on pressure–impact relationships (Figure 5 (a)). That is to say, input pressure-related numbers such as water consumption, tons of wastes and other pollutants emitted (SO2, CO, NOx) into a model which will convert such metrics into a synthetic indicator of biodiversity intactness for either a specific site or an entire value chain;
- Identifying the number of species on a given territory through field studies, comparing a species' abundance in an undisturbed reference situation to the abundance of the species in the impacted situation.
The first approach is less location specific but provides for a useful proxy of a whole value chain’s impact on biodiversity in a one sight see all perspective.
Figure 5: Graphical summary of the GLOBIO model
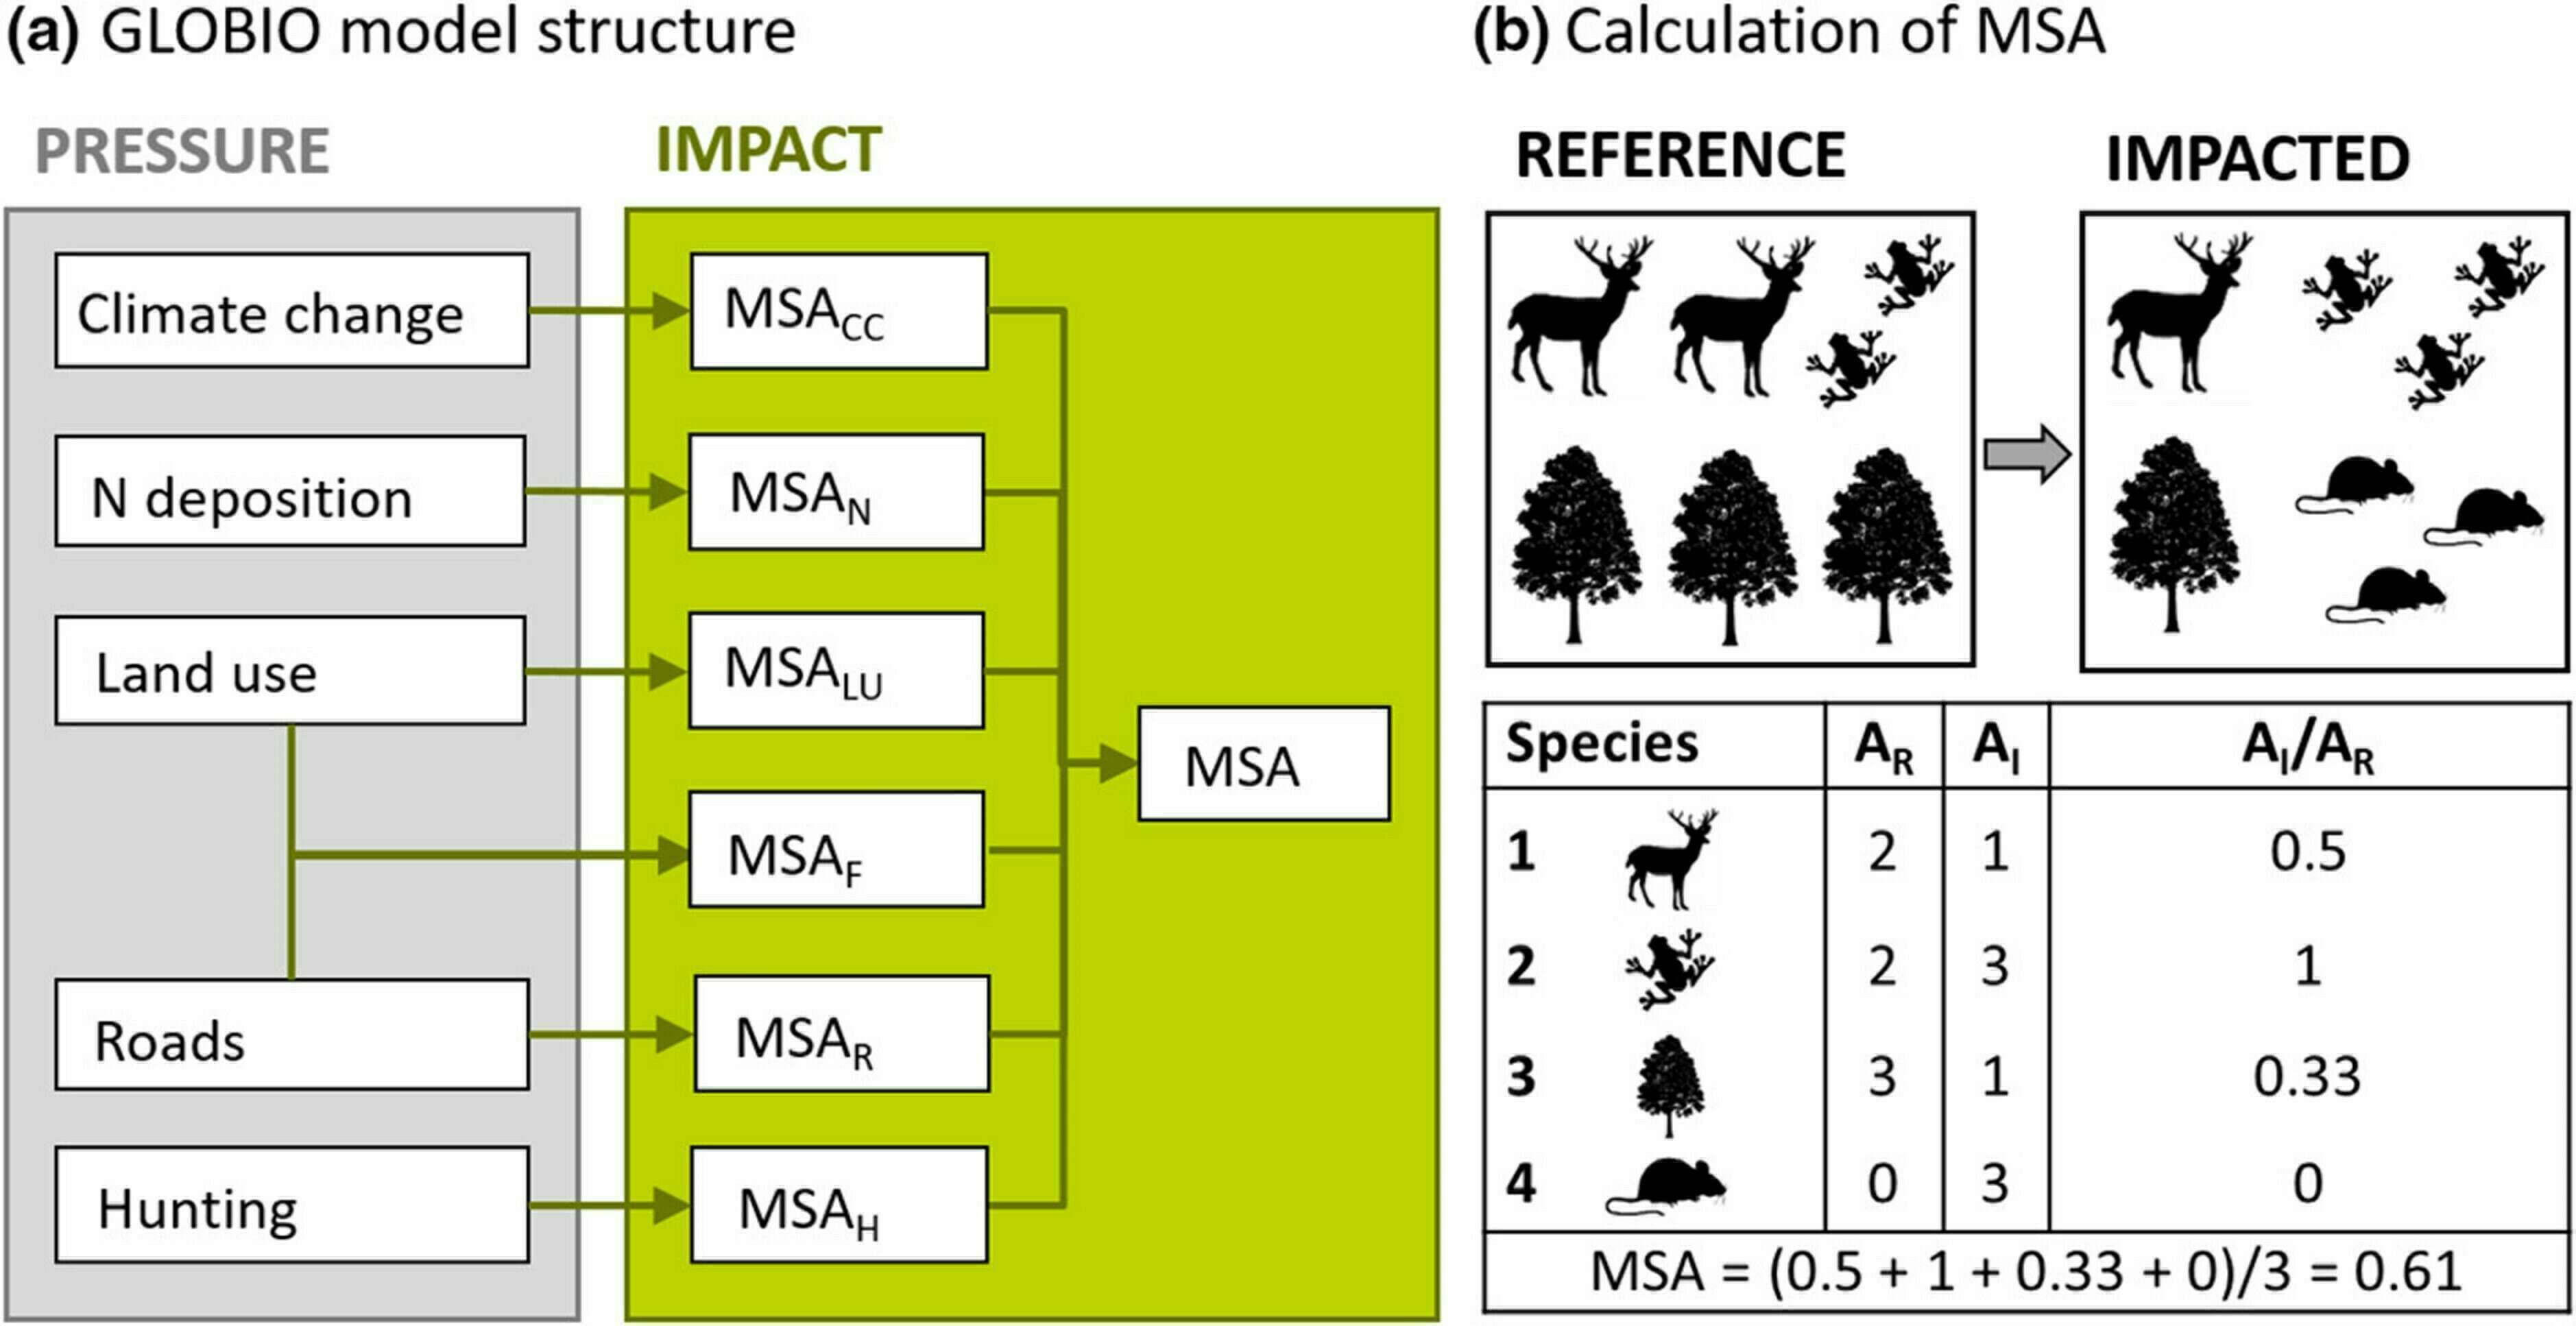
Source: Schipper, AM, Hilbers, JP, Meijer, JR, et al. Projecting terrestrial biodiversity intactness with GLOBIO 4. Glob Change Biol. 2020; 26: 760– 771.
The way forward for sustainable finance
During COP15, sustainable finance was mentioned as a key component to reach biodiversity objectives. Target n°19 which aims at “substantially and progressively increasing the level of financial resources from all sources” mentions instruments including green bonds, biodiversity offsets and credits, blended finance, impact funds and other instruments.
The call is clear, sustainable finance must play its part in halting and reversing biodiversity loss. It can rely on previous work established to finance climate change mitigation and adaptation efforts.
Green bonds have already referred to biodiversity-related expenditures on capital markets. however, the use-of-proceeds approach does not seem to be the best-fit for the topic as halting biodiversity loss does not necessarily require large capital investments but rather small ones, while operational processes and tools, company-level policies and strategies are more at stake. The forward-looking approach would better suit the topic to track change in practices and business models. In 2019, only 0.5-1.0% of green bonds’ proceeds were allocated to direct or indirect biodiversity protection measures.[8]
Sovereigns, regions and municipalities have been contributing the most to biodiversity management financing through green bonds. As an example, the French green OAT funded forest sustainable management programs, organic agricultural schemes and biodiversity protection efforts and reported annually on their results. In 2019, 15% (€ 857m) of the green bond proceeds collected throughout the year were allocated to biodiversity-related expenditures (7% in 2020 and 2021 with € 463m and € 1,111m respectively).[9]
Blue bonds[10], although more scarce, come as a relevant instruments to finance and achieve goals related to marine biodiversity. As an illustration, the Republic of Seychelles issued in 2018 the first sovereign blue bond. Proceeds raised ($15 million) are therefore used to support sustainable marine fisheries projects: the government made a policy commitment to safeguard 30% of its Exclusive Economic Zones through the extension of its Marine Protected Areas MPAs. Meanwhile the enhanced protection should help the Seychelles reduce its vulnerability to climate change, as the island is especially dependent on its marine resources (tourism, fisheries, livelihoods etc.).
Sustainability-linked bonds (SLB) and loans (SLL) seem better suited for such topic and many issuers already proposed biodiversity-related sustainability performance targets (SPTs). GHG emission KPIs set aside, 46 over 233 (20%) sustainability-linked bond frameworks analyzed and integrating environmental indicators have set either direct or indirect biodiversity-related KPIs.
|
Natixis GSH Biodiversity SLB anlysis |
Pressures |
Related KPIs used in SLBs |
Type of KPI |
|
Land use change |
4 |
Food waste (indirect), deforestation (direct) |
|
|
Direct exploitation |
35 |
Recycling rates (indirect), water consumption (direct) |
|
|
Pollution |
14 |
SO2, solid waste and sludge (direct) |
|
|
Invasive alien species |
0 |
None |
Source: Natixis GSH based on LGX Datahub
These indicators represent material sustainability issues for their issuers. Although they were not designed nor used with biodiversity in mind, they directly or indirectly contribute to halt and reverse biodiversity loss. One could expect as a next development on such KPIs and SPTs is, as part of the reporting, to see issuers attempt to quantify the relative impact on biodiversity of these SPTs’ achievement. The challenge though remains to have science-based or policy-based tools to benchmark targets and assess their level of ambition. COP15 targets may be used as such benchmark from now on. With the obvious rise of biodiversity in the global priority agenda for policy makers, investors, financiers, corporates and civil society, one can expect biodiversity synthetic KPIs to enter more formally the SLL/ SLB space.
Most ambitious companies will turn to synthetic indicators encompassing the impact of their entire value chains to drive their biodiversity-related impacts and dependencies. Such indicators (as the Mean Species Abundance) may allow for a comprehensive approach of the matter.
Such indicators are prone to be used in Sustainability-Linked Bond/ Loan structuring as their holistic nature and similarities with carbon accounting (scopes) make them suitable in such structures which are aligned with the SLBP.
Sovereign SLBs as the best use case for COP15 engagement
The nascent SLB market segment for sovereigns (Chile, Uruguay…) makes for an obvious case for biodiversity-related sustainability-linked-bonds. Indicators such as the % of a country’s areas under protection or restoration schemes, as part of national biodiversity strategies and action plans (NBSAPs), are excellent candidates for SLB structuration, as are nationally determined contributions (NDCs).
Uruguay used the native forest area indicator in its SLB framework (available here) as a biodiversity-related KPI to contribute to SDG 15 “Life on Land” and its target 15.2: “Promote the implementation of sustainable management of all types of forests, halt deforestation, restore degraded forests and substantially increase afforestation and reforestation globally”.
In the end, even though the topic is complex, we expect fast market developments. Companies will build on their experience of climate-related decision making to build similar processes for biodiversity. The willingness to come up with a unique metric, that is fungible and comparable across companies and sectors must not muzzle biodiversity-related engagement.
Appendix A: Definition of pressure categories
|
Nature-related issue area |
Pressure category |
Definition |
|
Land/Water/Sea Use Change |
Terrestrial ecosystem use |
Examples include area of agriculture by type, area of forest plantation by type, area of open cast mine by type, etc. |
|
Freshwater ecosystem use |
Examples include area of wetland, ponds, lakes, streams, rivers or peatland necessary to provide ecosystem services such as water purification, fish spawning, areas of infrastructure necessary to use rivers and lakes such as bridges, dams, and flood barriers, etc. |
|
|
Marine ecosystem use |
Examples include area of aquaculture by type, area of seabed mining by type, etc. |
|
|
Resource exploitation |
Water use |
Examples include volume of groundwater consumed, volume of surface water consumed, etc. |
|
Other resource use |
Examples include volume of mineral extracted, volume of wild-caught fish by species, number of wild-caught mammals by species, etc. |
|
|
Climate Change |
GHG emissions |
Examples include volume of carbon dioxide (CO2), methane (CH4), nitrous oxide (N2O), Sulphur hexafluoride (SF6), Hydrofluorocarbons, (HFCs) and perfluorocarbons (PFCs), etc. |
|
Pollution |
Non-GHG air pollutants |
Examples include volume of fine particulate matter (PM2.5) and coarse particulate matter (PM10), Volatile Organic Compounds (VOCs), mono-nitrogen oxides (NO and NO2, commonly referred to as NOx), Sulphur dioxide (SO2), Carbon monoxide (CO), etc. |
|
Water pollutants |
Examples include volume discharged to receiving water body of nutrients (e.g., nitrates and phosphates) or other substances (e.g., heavy metals and chemicals). |
|
|
Soil pollutants |
Examples include volume of waste matter discharged and retained in soil over a given period. |
|
|
Solid waste |
Examples include volume of waste by classification (i.e., nonhazardous, hazardous, and radioactive), by specific material constituents (e.g., lead, plastic), or by disposal method (e.g., landfill, incineration, recycling, specialist processing). |
|
|
Invasives and Other |
Disturbances |
Examples include decibels and duration of noise, lumens and duration of light, at site of impact. |
|
Biological alterations/interferences |
Examples include number of non-native and invasive animals or plants released by species, area of agriculture with genetically modified organisms or reduced genetic diversity, number of animals at risk of catching cattle-transmitted disease by species, etc. |
Source: Science Based Target Network

[1] UNEP-WCMC, Protected Planet Report.
[2] PBL (2012), Roads from Rio+20 Pathways to achieve global sustainability goals by 2050.
[3] European Commission (2021), assessment of biodiversity measurement approaches for businesses and financial institutions.
[4] More details related to pressures on biodiversity can be found in Appendix A
[5] See our dedicated study, Brown industries: the Transition Tightrope.
[6] IUCN (2014). Biodiversity management in the cement and aggregates sector: Biodiversity Indicator and Reporting System.
[7] Lafarge (2021), Sustainable development report.
[8] Deutz et al. (2020), Financing Nature : Closing the global biodiversity financing gap.
[9] AFT 2022, Green OATs allocation and performance report 2021.
[10] The World Bank defines blue bonds as a “debt instrument issued by governments, development banks or others to raise capital from impact investors to finance marine and ocean-based projects that have positive environmental, economic and climate benefits”. As it is inspired by the green bond concept, a blue bond is a use-of-proceeds instrument, meaning that it should be dedicated to a specific marine project.